
Our stock screening tool has identified RENAISSANCERE HOLDINGS LTD (NYSE:RNR) as an undervalued gem with strong fundamentals. RNR boasts decent financial health and profitability while maintaining an attractive price point. We'll break it down further.
How do we evaluate the Valuation for RNR?
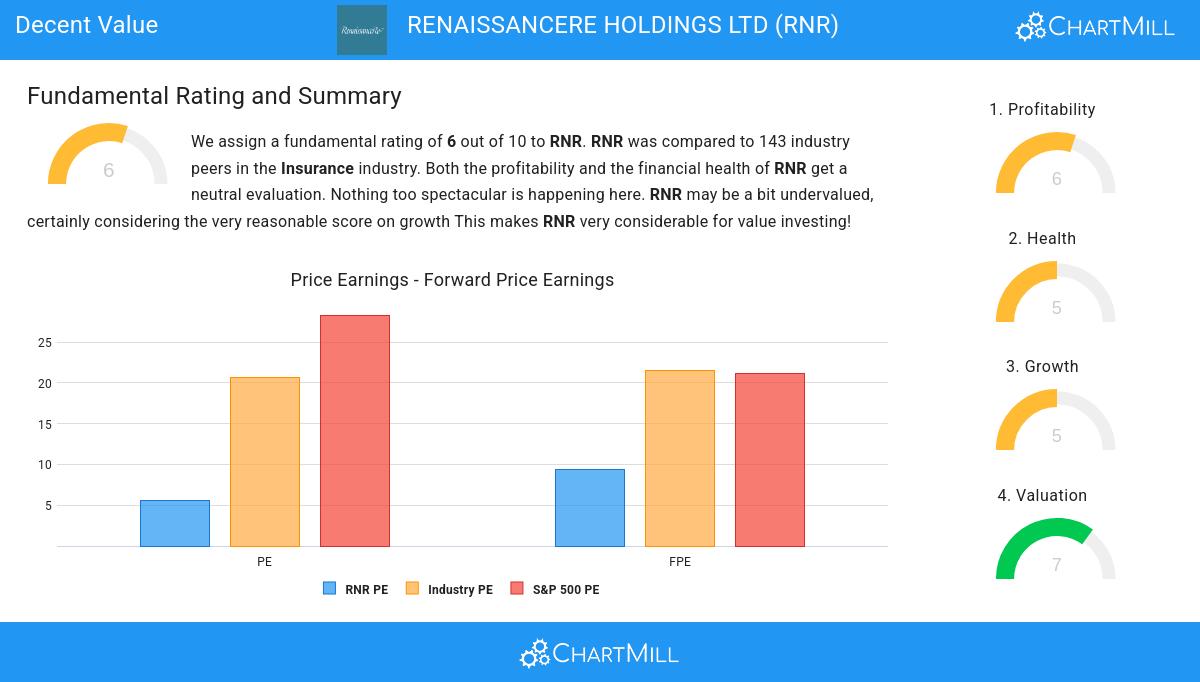
An integral part of ChartMill's stock analysis is the Valuation Rating, which spans from 0 to 10. This rating evaluates diverse valuation factors, including price to earnings and cash flows, while considering the stock's profitability and growth. RNR has received a 7 out of 10:
- RNR is valuated cheaply with a Price/Earnings ratio of 5.61.
- Based on the Price/Earnings ratio, RNR is valued a bit cheaper than the industry average as 79.72% of the companies are valued more expensively.
- Compared to an average S&P500 Price/Earnings ratio of 28.31, RNR is valued rather cheaply.
- With a Price/Forward Earnings ratio of 9.43, the valuation of RNR can be described as very reasonable.
- 62.94% of the companies in the same industry are more expensive than RNR, based on the Price/Forward Earnings ratio.
- Compared to an average S&P500 Price/Forward Earnings ratio of 21.14, RNR is valued rather cheaply.
- Based on the Enterprise Value to EBITDA ratio, RNR is valued cheaper than 86.01% of the companies in the same industry.
- 81.12% of the companies in the same industry are more expensive than RNR, based on the Price/Free Cash Flow ratio.
- The decent profitability rating of RNR may justify a higher PE ratio.
Profitability Analysis for RNR
ChartMill employs its own Profitability Rating system for stock evaluation. This score, ranging from 0 to 10, is derived from an analysis of diverse profitability metrics and margins. In the case of RNR, the assigned 6 is noteworthy for profitability:
- RNR has a better Return On Assets (4.27%) than 80.42% of its industry peers.
- RNR has a Return On Equity of 20.49%. This is amongst the best in the industry. RNR outperforms 81.82% of its industry peers.
- RNR has a better Return On Invested Capital (6.61%) than 87.41% of its industry peers.
- RNR has a better Profit Margin (18.22%) than 84.62% of its industry peers.
- RNR has a better Operating Margin (35.53%) than 95.80% of its industry peers.
- RNR's Operating Margin has improved in the last couple of years.
A Closer Look at Health for RNR
ChartMill employs its own Health Rating for stock assessment. This rating, ranging from 0 to 10, is calculated by examining various liquidity and solvency ratios. In the case of RNR, the assigned 5 reflects its health status:
- RNR has a Altman-Z score of 0.91. This is in the better half of the industry: RNR outperforms 79.02% of its industry peers.
- RNR has a debt to FCF ratio of 0.45. This is a very positive value and a sign of high solvency as it would only need 0.45 years to pay back of all of its debts.
- RNR has a better Debt to FCF ratio (0.45) than 82.52% of its industry peers.
- A Debt/Equity ratio of 0.18 indicates that RNR is not too dependend on debt financing.
- Looking at the Debt to Equity ratio, with a value of 0.18, RNR is in the better half of the industry, outperforming 72.03% of the companies in the same industry.
- RNR's Current ratio of 0.61 is fine compared to the rest of the industry. RNR outperforms 76.92% of its industry peers.
- RNR has a better Quick ratio (0.61) than 76.92% of its industry peers.
Understanding RNR's Growth
ChartMill assigns a Growth Rating to every stock. This score ranges from 0 to 10 and evaluates the different growth aspects like EPS and Revenue, both in the past as in the future. RNR scores a 5 out of 10:
- RNR shows a strong growth in Earnings Per Share. In the last year, the EPS has been growing by 15.74%, which is quite good.
- The Earnings Per Share has been growing by 36.08% on average over the past years. This is a very strong growth
- Looking at the last year, RNR shows a quite strong growth in Revenue. The Revenue has grown by 16.25% in the last year.
- Measured over the past years, RNR shows a very strong growth in Revenue. The Revenue has been growing by 23.24% on average per year.
Our Decent Value screener lists more Decent Value stocks and is updated daily.
Our latest full fundamental report of RNR contains the most current fundamental analsysis.
Disclaimer
Important Note: The content of this article is not intended as trading advice. It is essential to perform your own analysis and exercise caution when making trading decisions. The article presents observations created by automated analysis but does not guarantee any trading or investment outcomes. Always trade responsibly and make independent judgments.