
In this article, we'll take a closer look at RAMBUS INC (NASDAQ:RMBS) as a potential candidate for growth investing. While it's important for investors to conduct their own research, RAMBUS INC has piqued our interest by appearing on our strong growth and breakout radar. Let's explore further.
Growth Analysis for RMBS
A key component of ChartMill's stock assessment is the Growth Rating, which spans from 0 to 10. This rating evaluates diverse growth factors, such as EPS and revenue growth, considering both past performance and future projections. RMBS has received a 8 out of 10:
- The Earnings Per Share has grown by an impressive 21.64% over the past year.
- Measured over the past years, RMBS shows a quite strong growth in Earnings Per Share. The EPS has been growing by 14.14% on average per year.
- The Revenue has grown by 20.71% in the past year. This is a very strong growth!
- RMBS shows quite a strong growth in Revenue. Measured over the last years, the Revenue has been growing by 19.59% yearly.
- The Earnings Per Share is expected to grow by 21.01% on average over the next years. This is a very strong growth
- RMBS is expected to show quite a strong growth in Revenue. In the coming years, the Revenue will grow by 9.86% yearly.
- The EPS growth rate is accelerating: in the next years the growth will be better than in the last years.
Health Insights: RMBS
ChartMill assigns a proprietary Health Rating to each stock. The score is computed by evaluating various liquidity and solvency ratios and ranges from 0 to 10. RMBS was assigned a score of 10 for health:
- RMBS has an Altman-Z score of 15.53. This indicates that RMBS is financially healthy and has little risk of bankruptcy at the moment.
- RMBS has a Altman-Z score of 15.53. This is amongst the best in the industry. RMBS outperforms 88.07% of its industry peers.
- RMBS has no outstanding debt. Therefor its Debt/Equity and Debt/FCF ratios are 0 and belong to the best of the industry.
- RMBS has a Current Ratio of 8.44. This indicates that RMBS is financially healthy and has no problem in meeting its short term obligations.
- RMBS's Current ratio of 8.44 is amongst the best of the industry. RMBS outperforms 93.58% of its industry peers.
- RMBS has a Quick Ratio of 7.89. This indicates that RMBS is financially healthy and has no problem in meeting its short term obligations.
- RMBS has a better Quick ratio (7.89) than 96.33% of its industry peers.
How do we evaluate the Profitability for RMBS?
Discover ChartMill's exclusive Profitability Rating, a proprietary metric that assesses stocks on a scale of 0 to 10. It takes into consideration various profitability ratios and margins, both in absolute terms and relative to industry peers. Notably, RMBS has achieved a 8:
- RMBS has a better Return On Assets (13.39%) than 85.32% of its industry peers.
- Looking at the Return On Equity, with a value of 16.05%, RMBS is in the better half of the industry, outperforming 77.98% of the companies in the same industry.
- The Return On Invested Capital of RMBS (13.18%) is better than 85.32% of its industry peers.
- The last Return On Invested Capital (13.18%) for RMBS is above the 3 year average (9.26%), which is a sign of increasing profitability.
- RMBS's Profit Margin of 32.31% is amongst the best of the industry. RMBS outperforms 93.58% of its industry peers.
- In the last couple of years the Profit Margin of RMBS has grown nicely.
- RMBS has a Operating Margin of 33.21%. This is amongst the best in the industry. RMBS outperforms 93.58% of its industry peers.
- RMBS's Operating Margin has improved in the last couple of years.
- Looking at the Gross Margin, with a value of 80.22%, RMBS belongs to the top of the industry, outperforming 97.25% of the companies in the same industry.
Looking at the Setup
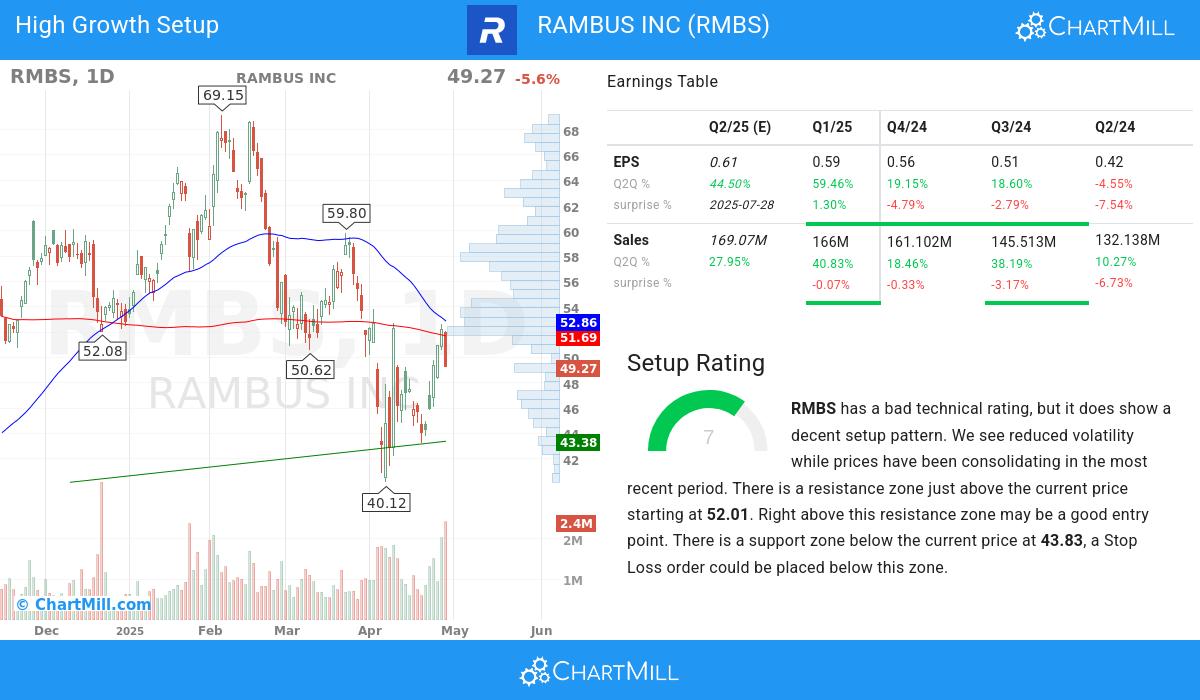
The Setup Rating of a stock determines to which extend the stock is consolidating. This score also ranges from 0 to 10 and is updated daily. The setup score evaluates various short term technical indicators. For RMBS this score is currently 7:
RMBS has a bad technical rating, but it does show a decent setup pattern. Prices have been consolidating lately and the volatility has been reduced. There is a resistance zone just above the current price starting at 52.01. Right above this resistance zone may be a good entry point. There is a support zone below the current price at 43.83, a Stop Loss order could be placed below this zone.
Our Strong Growth screener lists more Strong Growth stocks and is updated daily.
For an up to date full fundamental analysis you can check the fundamental report of RMBS
For an up to date full technical analysis you can check the technical report of RMBS
Disclaimer
This is not investing advice! The article highlights some of the observations at the time of writing, but you should always make your own analysis and invest based on your own insights.