
A systematic method for stock selection mixes technical strength with fundamental growth, forming a strong methodology for finding possible market leaders. The Mark Minervini Trend Template supplies the technical structure, making sure stocks are in confirmed uptrends with solid relative strength, while high growth momentum standards confirm underlying business speed through earnings, revenue growth, and positive estimate changes. This two-part method screens for stocks showing both price momentum and fundamental progress, traits frequently seen before major price increases.
Technical Strength Via Trend Template
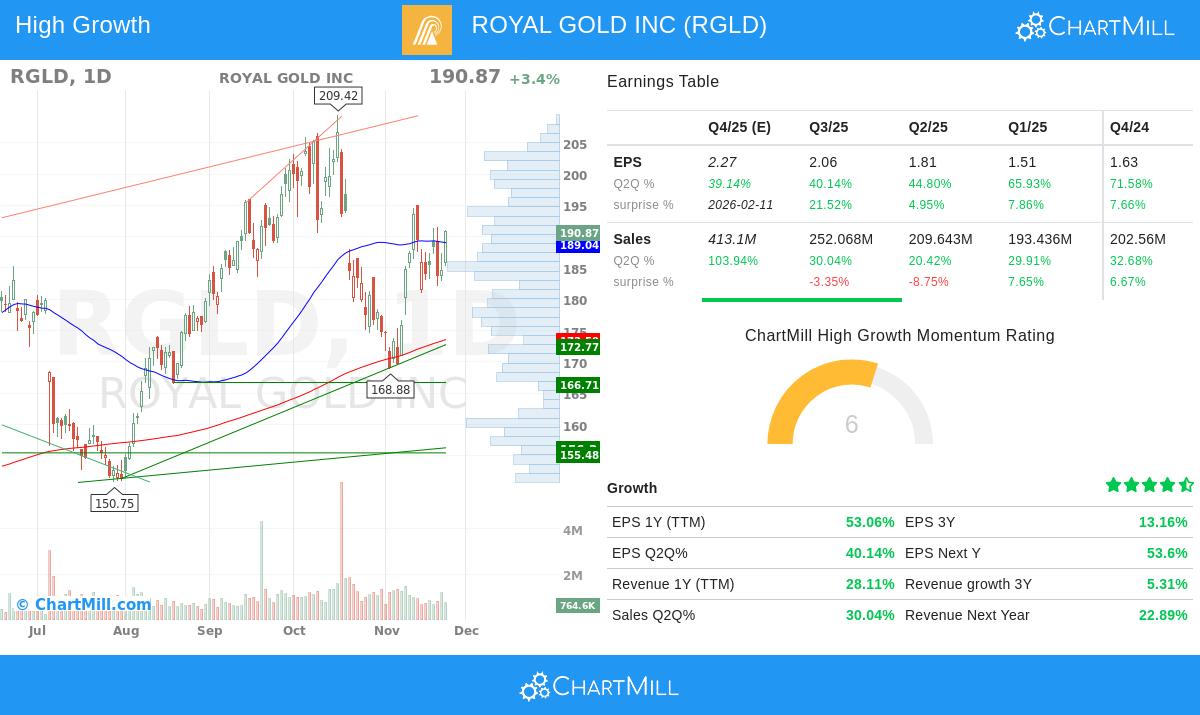
ROYAL GOLD INC (NASDAQ:RGLD) shows solid technical agreement with Minervini's standards, starting with its location compared to important moving averages. The stock trades at $190.87, well above its 50-day ($189.04), 150-day ($178.61), and 200-day ($173.59) simple moving averages. This layered support system points to continued buying interest across various periods, a sign of stocks in steady uptrends. The 200-day moving average's upward path verifies the long-term positive structure Minervini highlights as needed for reducing downside risk.
The stock's location inside its 52-week range further confirms its technical strength. Now trading 46% above its 52-week low of $130.67 and within 9% of its 52-week high of $209.42, RGLD displays the "high and tight" features Minervini looks for. Stocks trading close to their highs often show leadership qualities, as they have taken selling pressure while keeping upward momentum. The relative strength ranking of 86 means RGLD performs better than 86% of all stocks, an important filter Minervini uses to find market leaders before they are clear to the wider market.
Fundamental Growth Catalysts
The company's growth numbers show why it meets the requirements for high growth momentum investors. Earnings per share growth is at 53.06% over the trailing twelve months, with steady quarterly speed visible in the 40.14% latest quarter growth, 44.8% prior quarter, and 65.93% two quarters before. This sequence of speeding earnings growth is exactly what Minervini's SEPA method finds as a main trait of developing leaders. The company has surpassed EPS estimates in all of the past four quarters by an average of 10.50%, showing its capacity to beat expectations, another Minervini fundamental filter.
Revenue growth supports the earnings story, with 28.11% year-over-year growth and solid quarterly performance including 30.04% in the latest quarter. Analyst belief is increasing, with next-year EPS estimates changed upward by 6.24% and revenue estimates by 6.38% over the past three months. These upward changes often come before institutional accumulation, as Minervini states that "big earnings attract big attention" from major market players. Profit margins stay strong at 50.31% in the most recent quarter, indicating pricing ability and operational effectiveness.
Market Situation and Risk Control
The present market situation offers a positive setting, with the S&P 500 showing a positive short-term trend even with a neutral long-term view. RGLD's technical rating of 7 and setup rating of 7 imply the stock is in a good consolidation stage inside its wider uptrend. The noted support areas between $181.54,$189.04 give logical places for stop-loss placement, matching Minervini's focus on specific risk management before entry.
The stock's consolidation pattern shows a possible volatility squeeze setup, where smaller price changes and volume often come before the next upward move. With resistance noted at $206.66, a move above this level could indicate returning momentum. The average daily volume of 1.27 million shares guarantees enough liquidity for institutional involvement, another factor Minervini thinks is necessary for major price movements.
Technical Evaluation Summary
According to ChartMill's technical evaluation, RGLD gets a good technical rating of 7 out of 10, showing steady overall performance even with some recent doubt. The evaluation finds five important support areas, with the strongest going from $181.54 to $189.04, made by several trend lines and moving averages across time periods. Resistance is noted at $206.66, giving a clear level to watch for possible move above confirmation. The setup quality implies lower volatility during recent consolidation, with little resistance above present levels.
View the complete technical analysis for RGLD for detailed support and resistance levels, trend evaluation, and trade setup ideas.
Finding Related Opportunities
For investors looking for more candidates that meet both Minervini Trend Template standards and high growth momentum filters, this predefined screen finds stocks with similar technical and fundamental features.
Disclaimer: This analysis is for informational and educational purposes only and does not constitute investment advice. The information presented should not be interpreted as a recommendation to buy, sell, or hold any security. Always conduct your own research and consider your financial situation, risk tolerance, and investment objectives before making any investment decisions. Past performance does not guarantee future results.