
ROYAL GOLD INC (NASDAQ:RGLD) has become an interesting option for investors using systematic growth and momentum plans. The stock was found through a screening process that joins Mark Minervini's strict Trend Template with a High Growth Momentum (HGM) rating, a method made to find equities showing both good technical health and improving fundamental performance. This two-part plan aims to find market leaders in clear uptrends with underlying business speed, possibly presenting good risk/reward setups.
Technical Strength and Trend Template Alignment
The Minervini Trend Template gives a structured system to identify stocks in strong, steady uptrends. ROYAL GOLD INC shows a near-perfect match with these technical rules, which is made to filter for securities with better relative strength and positive speed across different time periods.
Key technical measurements confirming this match include:
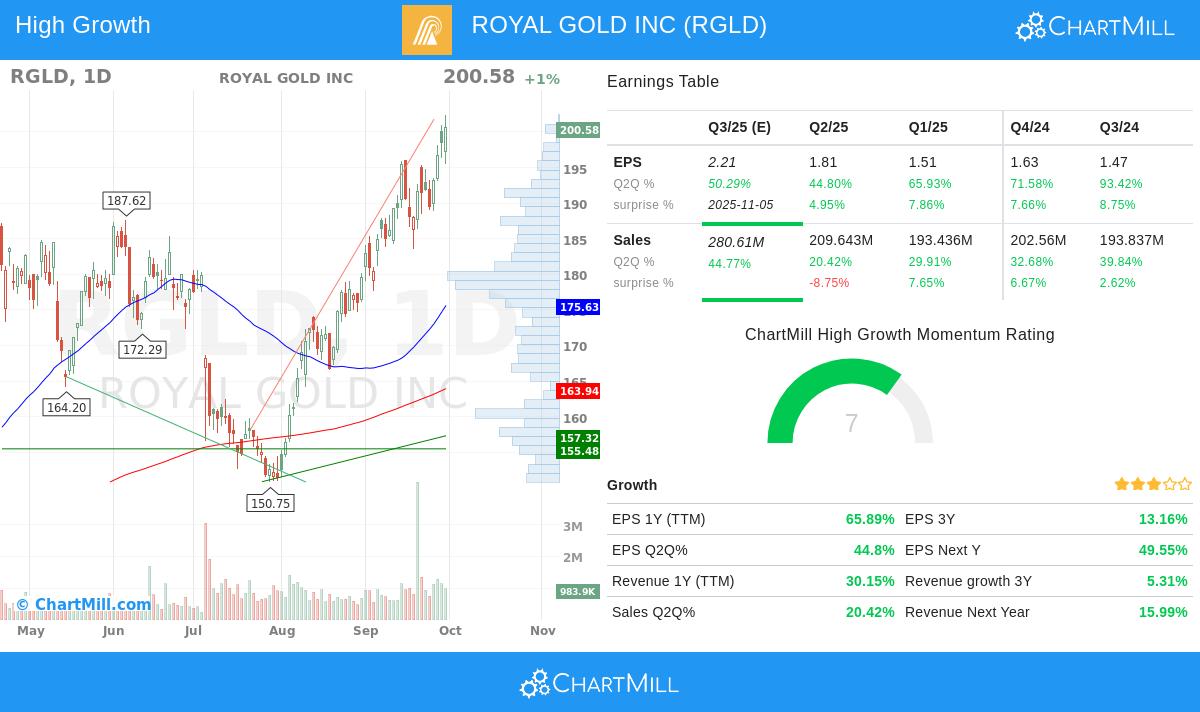
- Price vs. Moving Averages: The current price of $200.58 trades well above its rising 50-day ($175.63), 150-day ($171.64), and 200-day ($163.94) simple moving averages. This setup meets the template's need for the price to be above all three key averages, confirming both short-term and long-term positive trends.
- Moving Average Alignment: The 50-day SMA is located above the 150-day SMA, which is above the 200-day SMA. This ordered lineup of faster averages above slower ones is a standard sign of a good Stage 2 advance, showing coordinated buying pressure across different investor time frames.
- Proximity to Highs: The stock is currently trading within 0.9% of its 52-week high of $202.38, meeting the template's rule of being within 25% of the high. Stocks close to new highs often have the speed to continue their rise as they face little overhead resistance.
- Strong Recovery: RGLD's price is about 53% above its 52-week low of $130.67, well beyond the template's minimum requirement of 30%. This shows notable strength and a solid recovery trend.
- Superior Relative Strength: With a ChartMill Relative Strength (CRS) rating of 85.43, the stock is doing better than 85% of the market. High relative strength is a key part of the Minervini method, as it finds market leaders that tend to lead in a rally and fall less in a drop.
Fundamental Momentum for Growth Investors
Beyond a clean chart, the plan requires underlying fundamental energy to support continued growth. ROYAL GOLD INC shows several key measurements that add to its high Growth Momentum rating, indicating solid and improving business performance.
The company's earnings power has seen notable growth:
- Earnings Per Share (EPS) Growth: Trailing Twelve Months (TTM) EPS is at $6.42, showing a large 65.9% year-over-year rise. This improvement is steady on a quarterly basis, with the most recent quarter showing 44.8% growth compared to the same quarter last year.
- Earnings Surprises: The company has exceeded EPS estimates in all of the last four quarters, with an average surprise of 7.3%. Steady positive surprises often lead analysts to increase future estimates, drawing more institutional interest.
- Profit Margin Expansion: A key sign of operational efficiency and pricing power, the quarterly profit margin has gotten better in sequence, reaching 63.1% in the last reported quarter. This means a notable increase from 49.7% three quarters before, suggesting the company is turning more of its revenue into profit.
Revenue and cash flow creation have also been solid:
- Revenue Growth: TTM revenue growth is a good 30.2%, with the last reported quarter showing 20.4% year-over-year growth. Strong sales growth confirms that earnings gains are supported by real business growth.
- Free Cash Flow Surge: Free Cash Flow per Share (TTM) is $5.25, which has grown quickly by 172.8% over the past year. Solid and increasing cash flow gives the company financial options for acquisitions, debt payment, or shareholder returns.
Technical Analysis Overview
The detailed technical report for RGLD gives the stock a top rating of 10 out of 10, reflecting outstanding technical health. The report states that both long-term and short-term trends are positive, and the stock is making new 52-week highs. It finds several key support areas, the closest being between $188.01 and $189.90, made by a mix of trend lines and moving averages. While the technical rating is excellent, the report states the current setup rating is lower because of recent changing price movement, suggesting investors might look for a period of stability for a better entry point.
Finding Similar Opportunities
For investors looking for other companies that fit this mix of solid technical trends and high fundamental growth speed, the predefined screen is a useful starting place. You can find more possible options by looking at the High Growth Momentum + Trend Template screen on ChartMill.
Disclaimer: This article is for informational and educational purposes only and should not be seen as investment advice. The analysis does not form a recommendation to buy, sell, or hold any security. All investing involves risk, including the possible loss of principal. Investors should do their own research and talk with a qualified financial advisor before making any investment decisions.