
For investors wanting a systematic, long-term market method, few approaches have the substance of Peter Lynch's framework. The famous leader of Fidelity's Magellan Fund supported a "growth at a reasonable price" (GARP) idea, concentrating on firms with lasting earnings increase, good financial condition, and prices that do not overvalue that increase. His method, explained in One Up on Wall Street, stresses basic examination and a purchase-and-keep perspective, avoiding market prediction. It is a system made to find companies that are not only getting bigger, but doing so in a financially stable and fairly priced manner, a good match for steady investors aiming to create a varied collection over many years.
A recent filter using Lynch's main measures highlighted Dr. Reddy's Laboratories Ltd. (NYSE:RDY), a large worldwide medicine firm based in India. The company works in generics, branded generics, active pharmaceutical ingredients (APIs), and biosimilars, focusing on important treatment fields such as gastroenterology and cardiology. We will review how RDY fits the Lynch investment list and why it might deserve more study from GARP-focused investors.
Matching the Lynch Measures
The Peter Lynch filter uses particular number-based rules to find companies with a mix of increase, earnings, and financial strength. Dr. Reddy's Laboratories satisfies these important standards:
- Lasting Earnings Increase: Lynch looked for companies increasing earnings per share (EPS) between 15% and 30% each year over five years, quick enough to be interesting, but not so fast that it probably cannot last. RDY's five-year EPS increase rate of 23.6% falls well inside this preferred band, showing a solid and consistent historical rise in earnings.
- Fair Pricing (The PEG Ratio): Maybe the central part of Lynch's "reasonable price" idea is the Price/Earnings to Growth (PEG) ratio. A PEG at or under 1 implies the stock's price may not completely account for its increase path. RDY's PEG ratio, using its past five-year increase, is 0.79, indicating a possibly appealing price when increase is considered.
- Good Earnings (Return on Equity): Lynch preferred companies that effectively produce profits from shareholder equity. An ROE above 15% was his standard. RDY's ROE of 16.0% meets this mark, showing management's skill in providing sound returns on the money put into the business.
- Careful Financial Setup: To limit high risk, Lynch gave importance to companies with little debt. His filter uses a Debt/Equity ratio below 0.6, and he individually liked a ratio under 0.25. RDY does very well here, with an extremely low D/E ratio of 0.03, showing very little dependence on debt funding and a very strong balance sheet.
- Financial Condition (Current Ratio): Making sure a company can meet its near-term duties is a simple test of financial health. The filter needs a Current Ratio of at least 1. RDY's ratio of 1.85 indicates it has more than enough current assets to pay its current debts, giving a buffer.
A Top-Level Basic Review
Outside the specific filter rules, a wider view of Dr. Reddy's basic picture, as described in its detailed basic report, shows a high-level performer in its field.
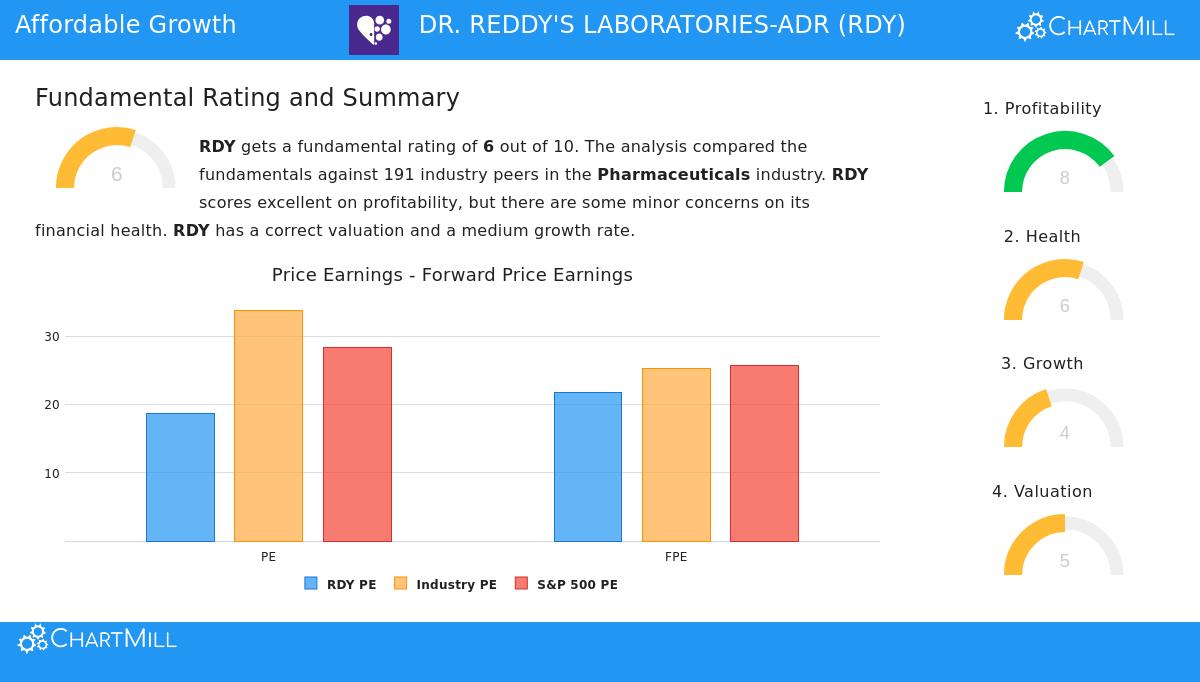
The company receives a good earnings score, with notable measures like Return on Invested Capital (13.0%) and Profit Margin (16.8%) placing it with the best in the pharmaceuticals industry. Its operating and gross margins are also solid and have gotten better in recent years.
The price evaluation is varied but tends favorable compared to similar companies. While its standard P/E ratio of 18.6 might seem high alone, it is viewed as low next to most industry rivals. More significantly, measures like Enterprise Value to EBITDA and Price to Free Cash Flow also propose RDY is priced more appealingly than the bulk of its pharmaceutical peers.
Points for investor notice are in its increase path and some cash measures. While past revenue and EPS increase have been good, experts forecast a slowing in EPS increase in the future. Also, while the company's ability to pay debts is very good (shown by its low debt and high Altman-Z score), its current and quick ratios, though sufficient, are below many industry rivals. This is a detail worth knowing in view of its particular business model and capital needs.
Is RDY a Lynch-Method Prospect?
For an investor using Peter Lynch's ideas, Dr. Reddy's Laboratories offers a strong example. It meets the necessary points: a long history of lasting, double-digit earnings increase, first-level earnings measures, an extremely strong balance sheet, and a price that seems fair when increase is measured through the PEG ratio. The company, focused on necessary generic drugs, fits the Lynch example of being clear and serving a constant, worldwide demand.
It is not without points to think about. The expected decrease in earnings increase is a main element to investigate more, as Lynch stressed knowing how and whether historical increase can go on. The lower cash ratios, while not a danger sign, justify a more detailed look at the company's management of working capital.
Investigating More
The Peter Lynch method is made to produce a short list of options for more investigation, not as a direct "purchase" sign. Dr. Reddy's Laboratories came from a filter using his main measures. For investors wanting to see other companies that currently meet this systematic test, you can view the complete Peter Lynch Strategy filter results here.
Disclaimer: This article is for information only and is not financial guidance, a suggestion, or an offer to purchase or sell any security. The Peter Lynch method is a historical framework, and past results do not guarantee future outcomes. Investors must do their own complete study and think about their personal financial situation and risk comfort before making any investment choices.