
The search for quality companies trading at reasonable prices is a foundation of many long-term investment methods. One of the most well-known approaches is the strategy made famous by Peter Lynch, the notable manager of the Fidelity Magellan Fund. His method centers on finding companies with good, lasting growth, sound financial condition, and firm profitability, all while making sure the stock price does not exceed the business's basic progress. This "growth at a reasonable price" (GARP) structure stays away from the limits of speculative growth investing and deep-value recoveries, looking instead for lasting compounders.
A recent filter based on Lynch's main ideas has identified DR. REDDY'S LABORATORIES-ADR (NYSE:RDY) as a possible choice for investors using this method. The Indian pharmaceutical company, with its wide range of products including generics, APIs, and branded drugs, seems to fit several important Lynch filters.
Fit with Peter Lynch Criteria
Peter Lynch stressed lasting growth, careful finances, and good value compared to that growth. The filter settings and RDY's related numbers present an interesting story:
- Lasting Earnings Growth: Lynch preferred companies with a demonstrated growth history that was not too high. The filter searches for a 5-year earnings per share (EPS) growth rate between 15% and 30%. RDY's EPS has increased at a notable average yearly rate of 23.6% over this time, putting it solidly within this "target range" of good yet possibly maintainable growth.
- Value Balanced by Growth: To prevent paying too much for growth, Lynch used the PEG ratio (Price/Earnings to Growth). A PEG at or under 1 implies the stock price may be fair relative to its historical growth rate. With a PEG ratio of 0.83, RDY's value seems to be fairly balanced by its past earnings performance.
- Good Profitability: A high Return on Equity (ROE) shows efficient use of shareholder money. Lynch wanted an ROE above 15%. RDY meets this with an ROE of 16.0%, indicating good and profitable operations.
- Careful Financial Condition: Lynch was cautious about high debt. The filter demands a Debt-to-Equity ratio below 0.6, with Lynch himself favoring levels below 0.25. RDY does very well here, having an extremely low Debt/Equity ratio of 0.03, showing a balance sheet funded almost completely by equity.
- Sufficient Short-Term Liquidity: The filter also includes a test for financial stability by needing a Current Ratio (current assets/current liabilities) of at least 1. RDY's ratio of 1.85 suggests more than enough liquidity to handle its near-term responsibilities.
Basic Condition Review
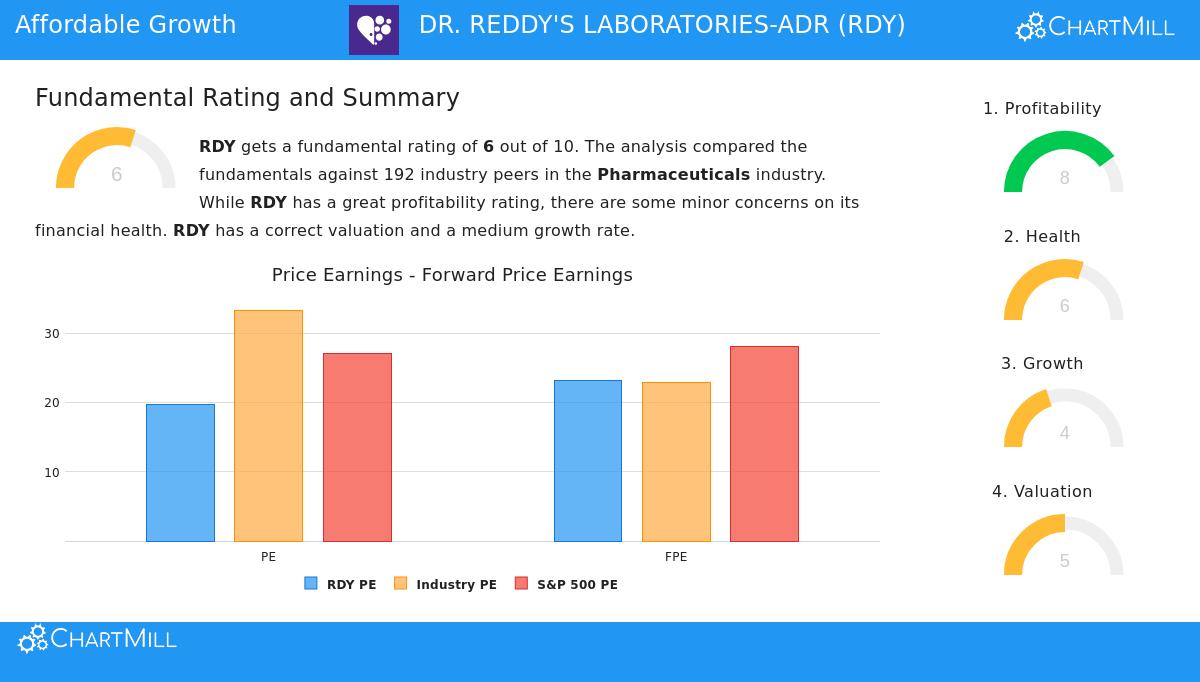
A wider view of DR. Reddy's basic profile, as described in its detailed analysis report, supports the image shown by the Lynch filter. The company gets an overall basic rating of 6 out of 10, doing well against its pharmaceutical industry competitors.
The notable area is profitability, where RDY gets an 8 out of 10. The company has industry-leading margins, with a Profit Margin of 16.8% and an Operating Margin of 19.6%, each doing better than most competitors. Its Return on Invested Capital (ROIC) of 13.0% is also with the best in the sector, confirming efficient use of capital.
Financial condition receives a middle score of 6. The company's ability to pay debts is very good, supported by its very low debt and strong Altman-Z score, which shows a very small chance of financial trouble. However, its liquidity ratios (Current and Quick Ratios), while sufficient, are seen as being in the lower part of the industry. Analysts note that given the good profitability and ability to pay debts, this may not be a major issue but is an area for investor note.
The value score is a 5. While RDY's P/E ratio of 19.7 is seen as high on its own, it is actually lower than most of its industry competitors. The perspective becomes more varied when looking at forward earnings estimates. The growth profile shows a clear split: a very good past history is compared with more limited expectations for the future, with EPS estimates indicating a small decrease. This slowing growth path is the main factor investors must consider against the company's other positives.
A Choice for the Long-Term Investor
For an investor using a Peter Lynch-style GARP method, DR. Reddy's offers a detailed case. It clearly meets the number-based tests Lynch supported: good historical growth at a fair PEG, very good profitability, and a very strong balance sheet. These are the signs of a well-managed business with a lasting advantage in the necessary healthcare sector.
The main warning comes from the expected growth slowdown, which is usual as companies get older. The Lynch strategy is naturally long-term, focusing on a 10-20 year view. The central question for a potential investor is whether DR. Reddy's can manage its market, keep developing, and get back to a maintainable mid-single-digit or better growth path that supports its value over the next ten years.
This review of DR. Reddy's Laboratories was prompted by a particular filter for Peter Lynch-style investments. You can see the present list of stocks meeting similar standards and use your own versions of this filter here.
Disclaimer: This article is for information only and does not make up financial advice, a support, or a suggestion to buy, sell, or hold any security. The Peter Lynch strategy is a model for basic study and not a promise of future results. All investing has risk, including the possible loss of principal. You should do your own complete study and think about talking with a qualified financial advisor before making any investment choices.