
Uncover the hidden value in QIFU TECHNOLOGY INC (NASDAQ:QFIN) as our stock screening tool recommends it as an undervalued choice. QFIN maintains a robust financial position and offers an attractive pricing perspective. Let's dig deeper into the analysis.
Analyzing Valuation Metrics
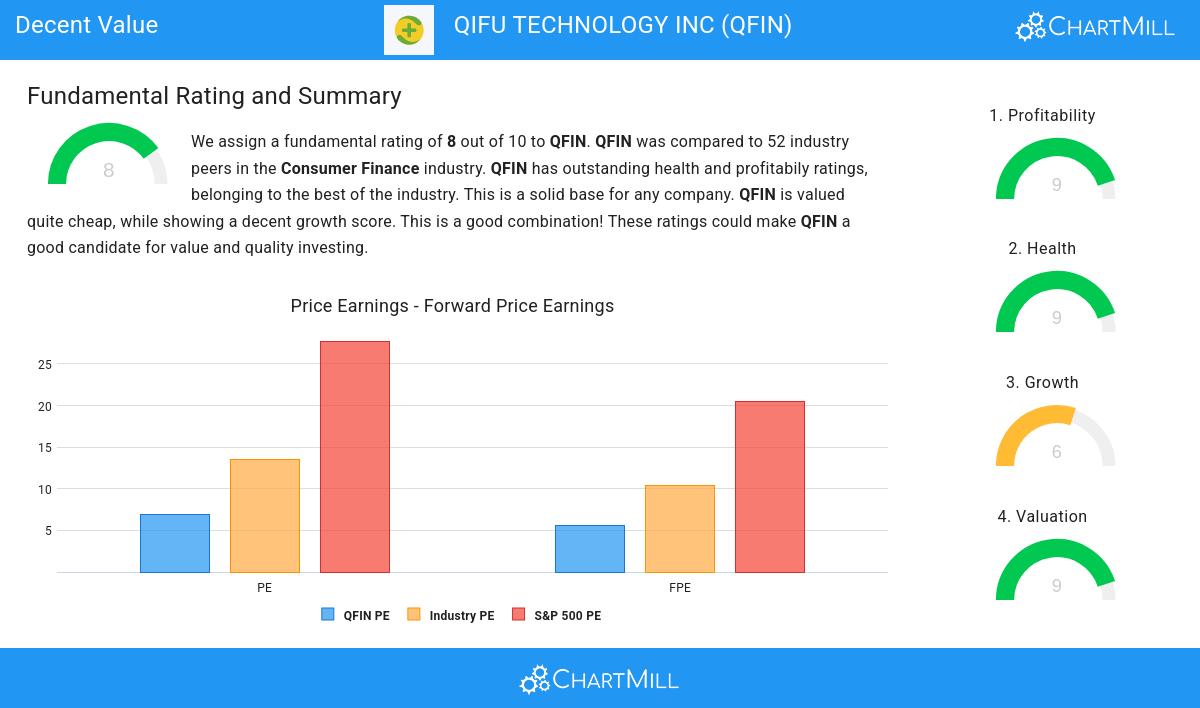
An integral part of ChartMill's stock analysis is the Valuation Rating, which spans from 0 to 10. This rating evaluates diverse valuation factors, including price to earnings and cash flows, while considering the stock's profitability and growth. QFIN has received a 9 out of 10:
- QFIN is valuated cheaply with a Price/Earnings ratio of 6.87.
- Compared to the rest of the industry, the Price/Earnings ratio of QFIN indicates a rather cheap valuation: QFIN is cheaper than 80.77% of the companies listed in the same industry.
- QFIN is valuated cheaply when we compare the Price/Earnings ratio to 27.75, which is the current average of the S&P500 Index.
- With a Price/Forward Earnings ratio of 5.55, the valuation of QFIN can be described as very cheap.
- 82.69% of the companies in the same industry are more expensive than QFIN, based on the Price/Forward Earnings ratio.
- When comparing the Price/Forward Earnings ratio of QFIN to the average of the S&P500 Index (20.49), we can say QFIN is valued rather cheaply.
- Compared to the rest of the industry, the Enterprise Value to EBITDA ratio of QFIN indicates a rather cheap valuation: QFIN is cheaper than 86.54% of the companies listed in the same industry.
- Based on the Price/Free Cash Flow ratio, QFIN is valued a bit cheaper than the industry average as 63.46% of the companies are valued more expensively.
- The low PEG Ratio(NY), which compensates the Price/Earnings for growth, indicates a rather cheap valuation of the company.
- QFIN has an outstanding profitability rating, which may justify a higher PE ratio.
- QFIN's earnings are expected to grow with 16.23% in the coming years. This may justify a more expensive valuation.
Profitability Analysis for QFIN
ChartMill employs its own Profitability Rating system for stock evaluation. This score, ranging from 0 to 10, is derived from an analysis of diverse profitability metrics and margins. In the case of QFIN, the assigned 9 is noteworthy for profitability:
- With an excellent Return On Assets value of 13.01%, QFIN belongs to the best of the industry, outperforming 92.31% of the companies in the same industry.
- Looking at the Return On Equity, with a value of 25.90%, QFIN belongs to the top of the industry, outperforming 86.54% of the companies in the same industry.
- QFIN has a better Return On Invested Capital (18.81%) than 92.31% of its industry peers.
- Measured over the past 3 years, the Average Return On Invested Capital for QFIN is significantly above the industry average of 8.74%.
- The 3 year average ROIC (16.14%) for QFIN is below the current ROIC(18.81%), indicating increased profibility in the last year.
- QFIN's Profit Margin of 36.49% is amongst the best of the industry. QFIN outperforms 98.08% of its industry peers.
- In the last couple of years the Profit Margin of QFIN has grown nicely.
- QFIN's Operating Margin of 43.86% is amongst the best of the industry. QFIN outperforms 98.08% of its industry peers.
- QFIN's Operating Margin has improved in the last couple of years.
- Looking at the Gross Margin, with a value of 83.10%, QFIN is in the better half of the industry, outperforming 78.85% of the companies in the same industry.
How We Gauge Health for QFIN
ChartMill utilizes a Health Rating to assess stocks, scoring them on a scale of 0 to 10. This rating takes into account a variety of liquidity and solvency ratios, both in absolute terms and in comparison to industry peers. QFIN has earned a 9 out of 10:
- An Altman-Z score of 3.14 indicates that QFIN is not in any danger for bankruptcy at the moment.
- Looking at the Altman-Z score, with a value of 3.14, QFIN belongs to the top of the industry, outperforming 84.62% of the companies in the same industry.
- QFIN has a debt to FCF ratio of 0.15. This is a very positive value and a sign of high solvency as it would only need 0.15 years to pay back of all of its debts.
- QFIN's Debt to FCF ratio of 0.15 is amongst the best of the industry. QFIN outperforms 94.23% of its industry peers.
- A Debt/Equity ratio of 0.06 indicates that QFIN is not too dependend on debt financing.
- QFIN has a Debt to Equity ratio of 0.06. This is amongst the best in the industry. QFIN outperforms 86.54% of its industry peers.
- A Current Ratio of 2.45 indicates that QFIN has no problem at all paying its short term obligations.
- QFIN has a better Current ratio (2.45) than 73.08% of its industry peers.
- A Quick Ratio of 2.45 indicates that QFIN has no problem at all paying its short term obligations.
- QFIN has a better Quick ratio (2.45) than 75.00% of its industry peers.
Understanding QFIN's Growth Score
To evaluate a stock's growth potential, ChartMill utilizes a Growth Rating on a scale of 0 to 10. This comprehensive assessment considers various growth aspects, including historical and estimated EPS and revenue growth. QFIN has achieved a 6 out of 10:
- The Earnings Per Share has grown by an impressive 57.05% over the past year.
- QFIN shows quite a strong growth in Earnings Per Share. Measured over the last years, the EPS has been growing by 19.96% yearly.
- Measured over the past years, QFIN shows a quite strong growth in Revenue. The Revenue has been growing by 13.24% on average per year.
- The Earnings Per Share is expected to grow by 16.23% on average over the next years. This is quite good.
- The Revenue is expected to grow by 8.48% on average over the next years. This is quite good.
More Decent Value stocks can be found in our Decent Value screener.
Our latest full fundamental report of QFIN contains the most current fundamental analsysis.
Disclaimer
Important Note: The content of this article is not intended as trading advice. It is essential to perform your own analysis and exercise caution when making trading decisions. The article presents observations created by automated analysis but does not guarantee any trading or investment outcomes. Always trade responsibly and make independent judgments.

