
Consider QIFU TECHNOLOGY INC (NASDAQ:QFIN) as an affordable growth stock, identified by our stock screening tool. NASDAQ:QFIN is showcasing impressive growth figures and is well-positioned in terms of profitability, solvency, and liquidity. Moreover, it seems to be priced reasonably. Let's dive deeper into the analysis.
Growth Assessment of NASDAQ:QFIN
Every stock receives a Growth Rating from ChartMill, ranging from 0 to 10. This rating assesses various growth aspects, including historical and projected EPS and revenue growth. NASDAQ:QFIN boasts a 8 out of 10:
- QFIN shows a strong growth in Earnings Per Share. In the last year, the EPS has been growing by 40.63%, which is quite impressive.
- QFIN shows quite a strong growth in Revenue. In the last year, the Revenue has grown by 9.41%.
- QFIN shows a strong growth in Revenue. Measured over the last years, the Revenue has been growing by 29.65% yearly.
- The Earnings Per Share is expected to grow by 27.08% on average over the next years. This is a very strong growth
- QFIN is expected to show quite a strong growth in Revenue. In the coming years, the Revenue will grow by 8.18% yearly.
- The EPS growth rate is accelerating: in the next years the growth will be better than in the last years.
Analyzing Valuation Metrics
ChartMill employs its own Valuation Rating system for all stocks. This score, ranging from 0 to 10, is determined by evaluating different valuation factors, including price to earnings and free cash flow, both in absolute terms and relative to the market and industry. NASDAQ:QFIN has earned a 9 for valuation:
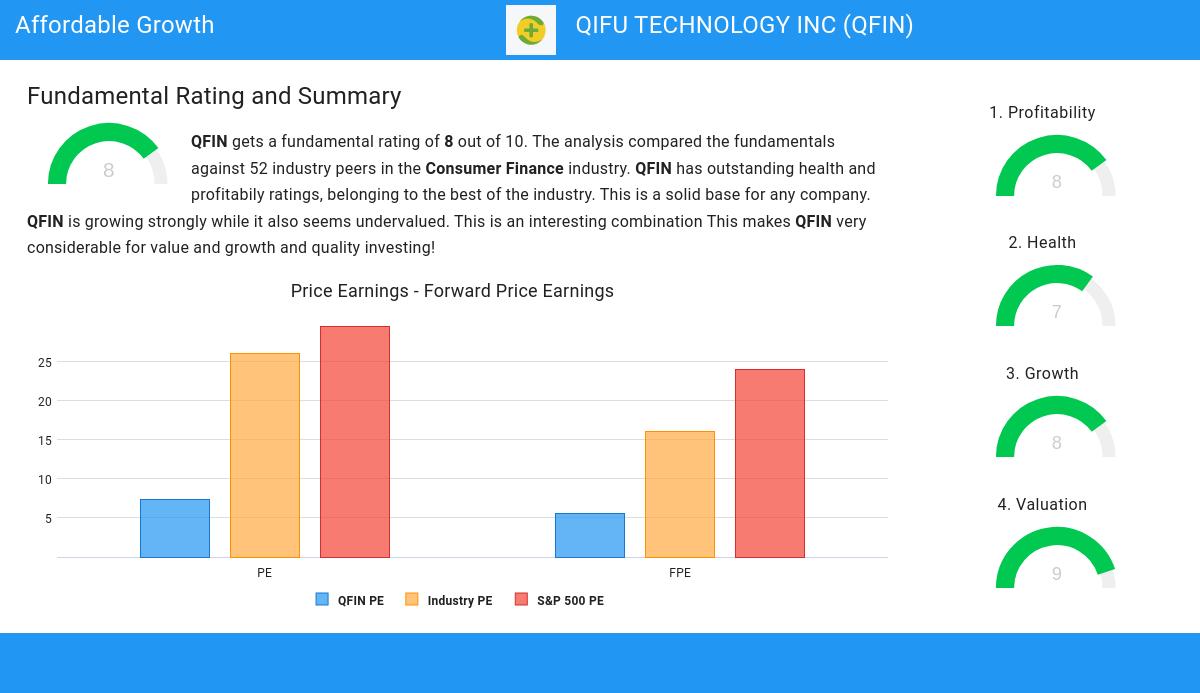
- QFIN is valuated cheaply with a Price/Earnings ratio of 7.32.
- QFIN's Price/Earnings ratio is rather cheap when compared to the industry. QFIN is cheaper than 80.77% of the companies in the same industry.
- QFIN is valuated cheaply when we compare the Price/Earnings ratio to 29.59, which is the current average of the S&P500 Index.
- A Price/Forward Earnings ratio of 5.53 indicates a rather cheap valuation of QFIN.
- Based on the Price/Forward Earnings ratio, QFIN is valued cheaper than 84.62% of the companies in the same industry.
- Compared to an average S&P500 Price/Forward Earnings ratio of 24.06, QFIN is valued rather cheaply.
- QFIN's Enterprise Value to EBITDA ratio is rather cheap when compared to the industry. QFIN is cheaper than 84.62% of the companies in the same industry.
- Based on the Price/Free Cash Flow ratio, QFIN is valued a bit cheaper than 61.54% of the companies in the same industry.
- The low PEG Ratio(NY), which compensates the Price/Earnings for growth, indicates a rather cheap valuation of the company.
- The excellent profitability rating of QFIN may justify a higher PE ratio.
- QFIN's earnings are expected to grow with 27.08% in the coming years. This may justify a more expensive valuation.
Assessing Health for NASDAQ:QFIN
A critical element of ChartMill's stock evaluation is the Health Rating, which spans from 0 to 10. This rating considers multiple health factors, including liquidity and solvency, both in absolute terms and relative to industry peers. NASDAQ:QFIN has received a 7 out of 10:
- QFIN has a debt to FCF ratio of 0.12. This is a very positive value and a sign of high solvency as it would only need 0.12 years to pay back of all of its debts.
- QFIN's Debt to FCF ratio of 0.12 is amongst the best of the industry. QFIN outperforms 94.23% of its industry peers.
- A Debt/Equity ratio of 0.05 indicates that QFIN is not too dependend on debt financing.
- The Debt to Equity ratio of QFIN (0.05) is better than 88.46% of its industry peers.
- QFIN has a Current Ratio of 2.56. This indicates that QFIN is financially healthy and has no problem in meeting its short term obligations.
- Looking at the Current ratio, with a value of 2.56, QFIN is in the better half of the industry, outperforming 75.00% of the companies in the same industry.
- QFIN has a Quick Ratio of 2.56. This indicates that QFIN is financially healthy and has no problem in meeting its short term obligations.
- With a decent Quick ratio value of 2.56, QFIN is doing good in the industry, outperforming 76.92% of the companies in the same industry.
What does the Profitability looks like for NASDAQ:QFIN
ChartMill assigns a proprietary Profitability Rating to each stock. The score is computed by evaluating various profitability ratios and margins and ranges from 0 to 10. NASDAQ:QFIN was assigned a score of 8 for profitability:
- QFIN's Return On Assets of 11.62% is amongst the best of the industry. QFIN outperforms 92.31% of its industry peers.
- Looking at the Return On Equity, with a value of 23.90%, QFIN belongs to the top of the industry, outperforming 86.54% of the companies in the same industry.
- QFIN's Return On Invested Capital of 18.00% is amongst the best of the industry. QFIN outperforms 94.23% of its industry peers.
- The Average Return On Invested Capital over the past 3 years for QFIN is significantly above the industry average of 7.43%.
- QFIN has a better Profit Margin (31.78%) than 92.31% of its industry peers.
- Looking at the Operating Margin, with a value of 40.27%, QFIN belongs to the top of the industry, outperforming 96.15% of the companies in the same industry.
- The Gross Margin of QFIN (83.13%) is better than 80.77% of its industry peers.
Our Affordable Growth screener lists more Affordable Growth stocks and is updated daily.
Check the latest full fundamental report of QFIN for a complete fundamental analysis.
Disclaimer
Important Note: The content of this article is not intended as trading advice. It is essential to perform your own analysis and exercise caution when making trading decisions. The article presents observations created by automated analysis but does not guarantee any trading or investment outcomes. Always trade responsibly and make independent judgments.