
For investors aiming to build wealth by finding companies trading below their intrinsic worth, the ideas of value investing give a time-tested method. Established by Benjamin Graham and famously used by Warren Buffett, this method looks for stocks with a market price below a calculated estimate of their true business value. The aim is to buy these "undervalued" assets with a sufficient "margin of safety" and keep them for the long term, letting the market finally recognize and fix the difference. A disciplined method needs looking at a company's financial condition, earnings, growth path, and, importantly, its current valuation numbers to avoid "value traps" and find real chances.
A recent search for such chances using a "Decent Value" filter, which finds stocks with good valuation scores while keeping acceptable fundamentals, has pointed to QUALCOMM INC (NASDAQ:QCOM) as a candidate for more review. The company's latest fundamental analysis report gives a structured look at its financial position across five main areas, offering a clear view of why it might interest a value-focused investor.
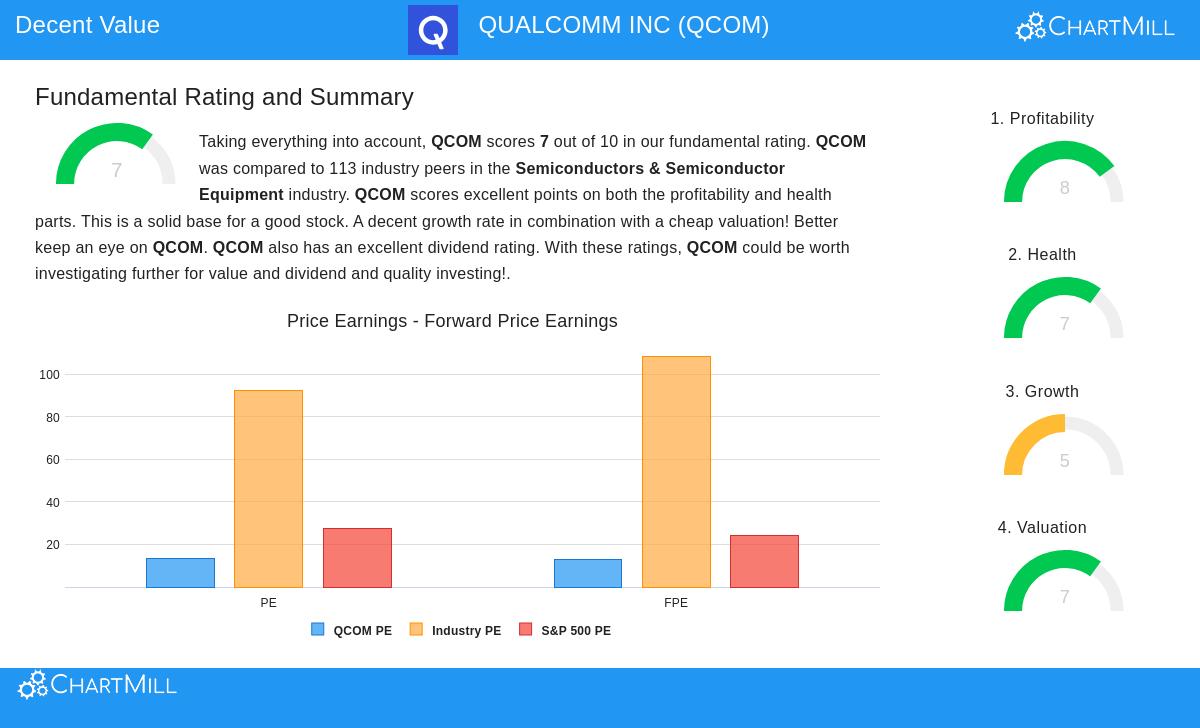
Valuation: The Center of the Chance
The main draw for a value investor is a stock's price compared to its financial results. QUALCOMM's valuation numbers appear especially interesting, getting a firm score of 7 out of 10 in this group. The figures imply the market may be valuing the company cautiously.
- Price-to-Earnings (P/E) Ratio: At 13.25, QCOM's P/E ratio is much lower than 95.6% of similar companies in the Semiconductors & Semiconductor Equipment industry, where the average P/E is above 92. It also rests well under the current S&P 500 average of about 27.5.
- Forward P/E Ratio: Looking forward, the view stays similar. A forward P/E of 12.89 shows the stock is valued more affordably than almost 95% of its industry rivals.
- Cash Flow and EBITDA Multiples: The value argument is also backed by the Price/Free Cash Flow and Enterprise Value/EBITDA ratios, both showing QCOM is valued more affordably than most (over 88%) of companies in its field.
For a value investor, these numbers are the beginning. They show the stock is trading at a lower price relative to both its present earnings and the wider market, giving a possible margin of safety if the core business stays sound.
Financial Health and Profitability: A Firm Base
A low-priced stock is only a good investment if the company is financially steady and able to produce earnings. This is where value investing needs careful fundamental study to tell temporary bargains from permanent value traps. QUALCOMM scores well here, with a Health score of 7 and an even better Profitability score of 8.
The company's financial condition is strong, marked by good solvency and liquidity:
- An Altman-Z score of 6.25 indicates a low near-term chance of financial trouble.
- Its debt amount is controllable, with a Debt to Free Cash Flow ratio of 1.16, meaning it could pay off all its debt with just over a year's cash flow.
- Current and Quick Ratios (2.82 and 2.10) show more than enough ability to meet short-term needs.
Profitability is likely QUALCOMM's biggest asset, supporting the valuation view:
- The company produces very good returns on capital, with a Return on Invested Capital (ROIC) of 21.4%, doing better than 94.7% of the industry. A three-year average ROIC of 17.5% confirms this is a lasting asset.
- Margins are good, with an Operating Margin of 28% rating among the best in its field.
- Importantly, QCOM has reported positive earnings and operating cash flow in each of the last five years, showing steady earning ability—a main quality value investors look for.
Growth and Dividend: Backing the Argument
While pure value picks sometimes include static companies, QUALCOMM adds parts of growth and income to its profile, though with some details. Its Growth score is a moderate 5.
- Past Results: The company has shown firm historical growth, with Revenue rising at an average yearly rate of 15.3% and Earnings Per Share (EPS) growing by 23.5% yearly over recent years.
- Future View: Analysts think growth will slow, with forward estimates pointing to high-single-digit EPS growth and mid-single-digit revenue growth. This slowing is noted in the report but is weighed against the company's low valuation.
- Dividend Income: With a Dividend score of 7, QCOM gives a yield of about 1.96%, which is above the industry average. It has a dependable history, having paid and raised its dividend for over ten years, adding an income part to the total return potential.
Conclusion: A Measured Value Picture
QUALCOMM shows a strong case for investors using a value method. It is not a deep-value, recovery story, but rather what could be called a "quality value" chance. The stock trades at a notable discount to its industry and the wider market based on standard earnings multiples, giving the basic margin of safety. This discount is combined with a very firm financial base and better profitability numbers, which help lower the risk of a value trap. While future growth is thought to be more measured, the company's established profit engine and shareholder-friendly dividend policy add to a complete investment profile.
The "Decent Value" filter that found QUALCOMM is made to find just this kind of stock: one that is fundamentally low-priced but not fundamentally weak. For investors wanting to look for similar chances that meet these conditions of good valuation, acceptable profitability, health, and growth, you can see the full filter and its present results here.
Disclaimer: This article is for information only and is not financial advice, a suggestion, or an offer to buy or sell any security. Investing has risk, including the possible loss of principal. You should do your own study and talk with a qualified financial advisor before making any investment choices.