
In the search for long-term investment opportunities, many investors turn to strategies that combine the discipline of value investing with the possibility of growth stocks. One of the most well-regarded methods is that of Peter Lynch, the famous manager of the Fidelity Magellan Fund. Lynch’s thinking, often called Growth at a Reasonable Price (GARP), centers on finding companies with good, lasting earnings growth that are priced at levels which do not overstate that future possibility. His system uses a group of basic filters to locate sound, profitable businesses that an investor can comprehend and own for the long term.
A recent filter built on Lynch’s main standards has identified PTC Inc. (NASDAQ:PTC) as a candidate for more study. The Boston-based software company offers a group of digital products for product lifecycle management, computer-aided design, and industrial Internet of Things, working with manufacturers and engineers around the world. We will look at how PTC matches the Lynch model and what its basic financial picture shows.
Match with Peter Lynch Standards
Peter Lynch looked for companies increasing earnings at a good, but not extreme, rate, funded carefully, and priced at an acceptable level compared to that growth. The filter used a number of numerical rules, and PTC’s present measurements show a good match:
- Lasting Earnings Growth: Lynch preferred a 5-year earnings per share (EPS) growth rate between 15% and 30%, thinking growth outside this area was often not lasting. PTC’s EPS has increased at an average yearly rate of 25.6% over the past five years, putting it directly within this target area and pointing to a good, steady history of profit.
- Acceptable Valuation (PEG Ratio): Maybe the central part of the GARP method, the Price/Earnings to Growth (PEG) ratio compares a stock’s price to its earnings growth rate. Lynch wanted a PEG of 1 or lower, hinting the market may not be completely valuing the company’s growth path. PTC’s PEG ratio, based on its past growth, is 0.85, indicating it may be acceptably priced relative to its history.
- Good Financial Condition: To limit high risk, Lynch stressed a solid balance sheet.
- Debt/Equity Ratio: He liked companies funded more by equity than debt, with a ratio below 0.6 (and preferably below 0.25). PTC’s Debt/Equity ratio of 0.31 shows a careful capital structure with workable debt.
- Current Ratio: This checks a company’s capacity to pay short-term debts. A ratio of at least 1 is needed, and PTC’s 1.43 suggests sufficient cash to cover its upcoming bills.
- High Profit (Return on Equity): Lynch wanted companies that effectively create profit from shareholder equity. A minimum Return on Equity (ROE) of 15% was his guide. PTC’s ROE of 19.3% shows a capacity to provide good returns on the money put into the business.
Basic Condition Review
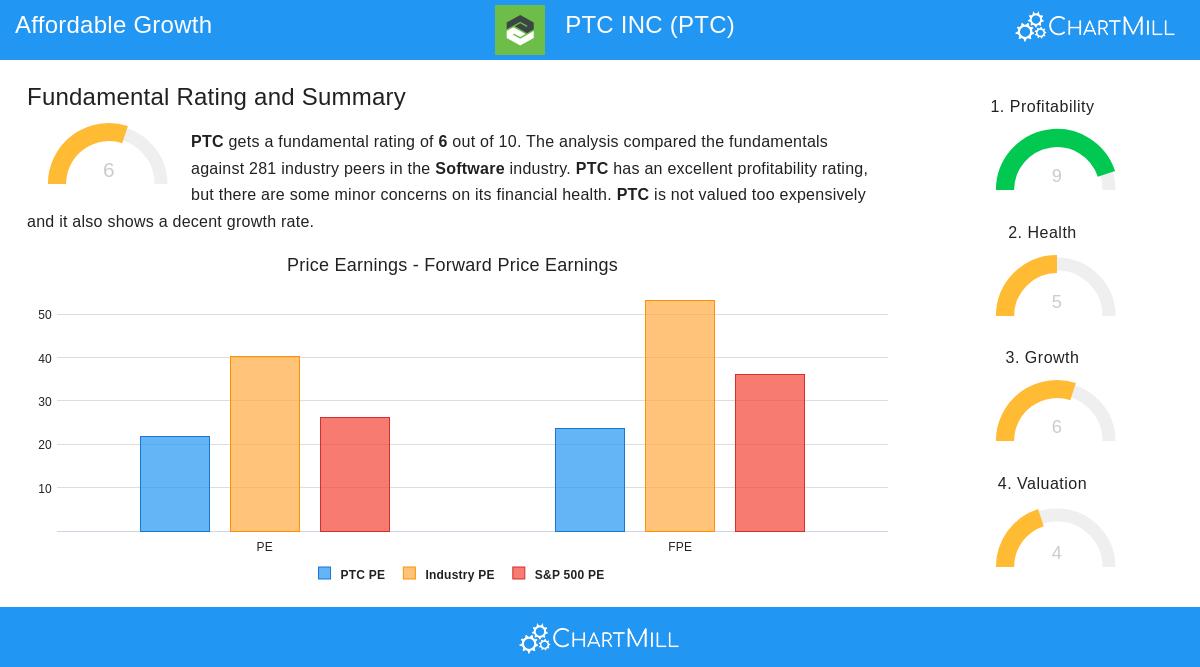
Beyond the specific filter rules, a wider view of PTC’s basic profile backs the idea. According to a detailed fundamental analysis report, the company gets an overall score of 6 out of 10, with clear positives and some points to note.
The notable feature is PTC’s very good profit, which scores a 9 out of 10. The company has top-level margins, including a Gross Margin of 83.8% and an Operating Margin of 36.5%. Its Return on Invested Capital (ROIC) of 13.8% also scores well within the software industry, pointing to effective use of capital.
Financial condition gets a medium score of 5. The positive solvency measurements, like a low Debt-to-Free-Cash-Flow ratio of 1.40, are good. However, the analysis states that while share count has gone down lately, it is still higher than five years ago, a detail long-term investors may want to watch concerning possible share value reduction.
Valuation is scored at 4, called "correct." While PTC’s P/E ratio of 21.9 is a bit under the industry average, the report notes it is priced like the wider S&P 500. The high profit is viewed as possibly supporting its present multiple.
Growth gets a score of 6. The past increase in revenue and EPS is described as good, but analyst forecasts point to a slower speed of earnings growth ahead. This expected moderation is a main point for investors to think about within the Lynch model, which values lasting growth.
Is PTC a Lynch-Method Chance?
For an investor following Peter Lynch’s ideas, PTC offers a notable example. It works in the comprehensible, if detailed, field of industrial software, a "simple" industry by Lynch’s positive description. Its finances meet the main condition and profit filters, and its price, when balanced with its strong historical growth rate, seems acceptable.
The main question for a GARP investor is if the company’s growth narrative stays believable. The good past performance meets Lynch’s standards, but the predicted decrease in EPS growth shows the need for more detailed study. An investor must judge whether PTC’s roles in product lifecycle management and industrial IoT can produce the stable, long-term growth that Lynch wanted.
Looking for More
The Peter Lynch filter is made to create a beginning list for basic research, not a list to buy. PTC is one of multiple companies that recently met this group of filters. Investors wanting to see other candidates that fit this growth-at-an-acceptable-price description can see the complete filter findings here.
Disclaimer: This article is for information only and is not financial advice, a suggestion, or an offer to buy or sell any security. The study is based on data and a set filtering system. Investors should do their own complete research and think about their personal money situation and risk comfort before making any investment choices.