
Consider PINTEREST INC- CLASS A (NYSE:PINS) as an affordable growth stock, identified by our stock screening tool. PINS is showcasing impressive growth figures and is well-positioned in terms of profitability, solvency, and liquidity. Moreover, it seems to be priced reasonably. Let's dive deeper into the analysis.
A Closer Look at Growth for PINS
ChartMill assigns a Growth Rating to each stock, ranging from 0 to 10. This rating is determined by analyzing different growth elements, including EPS and revenue growth, spanning both historical and future figures. In the case of PINS, the assigned 8 reflects its growth potential:
- The Earnings Per Share has grown by an impressive 31.82% over the past year.
- PINS shows quite a strong growth in Earnings Per Share. Measured over the last years, the EPS has been growing by 8.67% yearly.
- PINS shows quite a strong growth in Revenue. In the last year, the Revenue has grown by 19.35%.
- Measured over the past years, PINS shows a very strong growth in Revenue. The Revenue has been growing by 26.12% on average per year.
- The Earnings Per Share is expected to grow by 18.63% on average over the next years. This is quite good.
- PINS is expected to show quite a strong growth in Revenue. In the coming years, the Revenue will grow by 14.02% yearly.
- When comparing the EPS growth rate of the last years to the growth rate of the upcoming years, we see that the growth is accelerating.
How do we evaluate the Valuation for PINS?
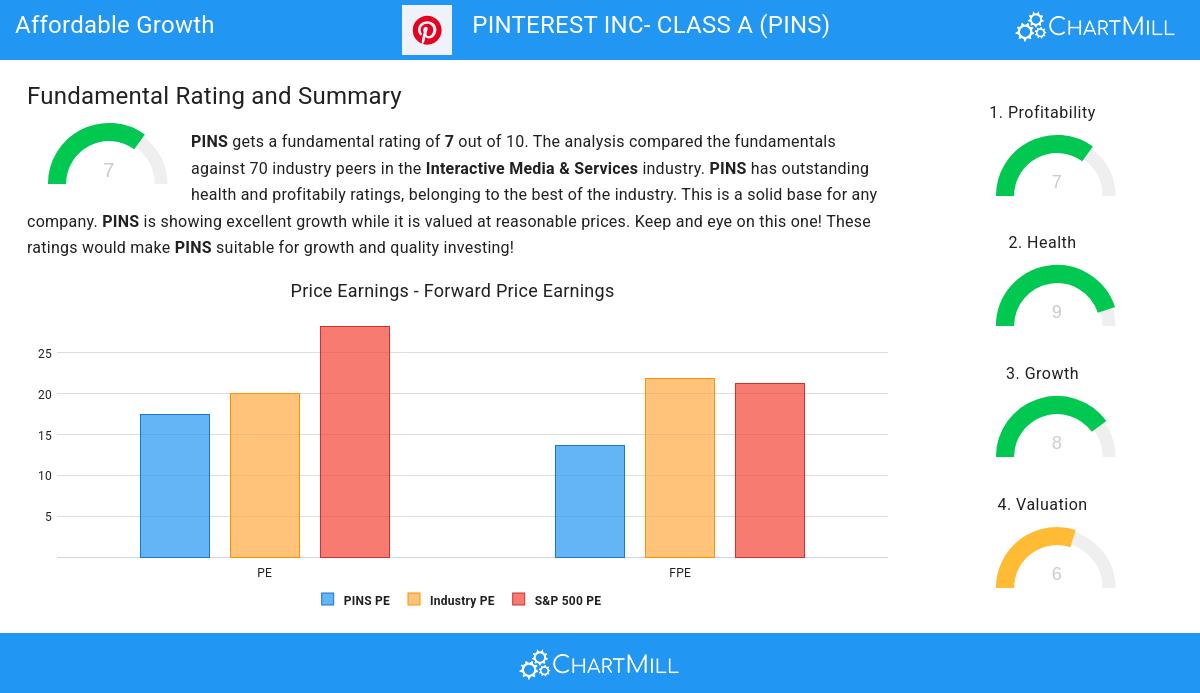
ChartMill provides a Valuation Rating to every stock, ranging from 0 to 10. This rating assesses various valuation aspects, comparing price to earnings and cash flows, while considering factors like profitability and growth. PINS boasts a 6 out of 10:
- Compared to the rest of the industry, the Price/Earnings ratio of PINS indicates a somewhat cheap valuation: PINS is cheaper than 70.00% of the companies listed in the same industry.
- Compared to an average S&P500 Price/Earnings ratio of 28.29, PINS is valued a bit cheaper.
- 72.86% of the companies in the same industry are more expensive than PINS, based on the Price/Forward Earnings ratio.
- The average S&P500 Price/Forward Earnings ratio is at 21.32. PINS is valued slightly cheaper when compared to this.
- 67.14% of the companies in the same industry are more expensive than PINS, based on the Price/Free Cash Flow ratio.
- The low PEG Ratio(NY), which compensates the Price/Earnings for growth, indicates a rather cheap valuation of the company.
- PINS has a very decent profitability rating, which may justify a higher PE ratio.
- A more expensive valuation may be justified as PINS's earnings are expected to grow with 21.64% in the coming years.
How do we evaluate the Health for PINS?
ChartMill assigns a proprietary Health Rating to each stock. The score is computed by evaluating various liquidity and solvency ratios and ranges from 0 to 10. PINS was assigned a score of 9 for health:
- An Altman-Z score of 18.74 indicates that PINS is not in any danger for bankruptcy at the moment.
- The Altman-Z score of PINS (18.74) is better than 97.14% of its industry peers.
- PINS has no outstanding debt. Therefor its Debt/Equity and Debt/FCF ratios are 0 and belong to the best of the industry.
- PINS has a Current Ratio of 8.75. This indicates that PINS is financially healthy and has no problem in meeting its short term obligations.
- PINS has a better Current ratio (8.75) than 95.71% of its industry peers.
- PINS has a Quick Ratio of 8.75. This indicates that PINS is financially healthy and has no problem in meeting its short term obligations.
- The Quick ratio of PINS (8.75) is better than 95.71% of its industry peers.
How do we evaluate the Profitability for PINS?
ChartMill assigns a proprietary Profitability Rating to each stock. The score is computed by evaluating various profitability ratios and margins and ranges from 0 to 10. PINS was assigned a score of 7 for profitability:
- PINS's Return On Assets of 34.85% is amongst the best of the industry. PINS outperforms 100.00% of its industry peers.
- Looking at the Return On Equity, with a value of 39.19%, PINS belongs to the top of the industry, outperforming 98.57% of the companies in the same industry.
- PINS's Return On Invested Capital of 2.87% is fine compared to the rest of the industry. PINS outperforms 67.14% of its industry peers.
- PINS has a better Profit Margin (51.07%) than 98.57% of its industry peers.
- PINS's Profit Margin has improved in the last couple of years.
- PINS's Operating Margin of 4.93% is fine compared to the rest of the industry. PINS outperforms 64.29% of its industry peers.
- PINS has a Gross Margin of 79.42%. This is in the better half of the industry: PINS outperforms 71.43% of its industry peers.
- PINS's Gross Margin has improved in the last couple of years.
Every day, new Affordable Growth stocks can be found on ChartMill in our Affordable Growth screener.
For an up to date full fundamental analysis you can check the fundamental report of PINS
Keep in mind
Important Note: The content of this article is not intended as trading advice. It is essential to perform your own analysis and exercise caution when making trading decisions. The article presents observations created by automated analysis but does not guarantee any trading or investment outcomes. Always trade responsibly and make independent judgments.