
For investors who use technical analysis to find possible opportunities, a disciplined screening process is important. One useful method involves filtering for stocks that have good technical scores and are making a constructive price pattern. This method tries to answer two important questions: which stock is in a good uptrend, and when is the best time to think about an entry? By joining a high "Technical Rating" to measure trend health with a high "Setup Quality Rating" to find consolidation phases, traders try to locate breakout candidates in leading stocks before they make their next big move.
Pfizer Inc. (NYSE:PFE) recently appeared from such a screen, showing a profile that fits this breakout method. The pharmaceutical company's stock now displays the two traits that technical investors frequently look for: basic strength and a clear setup.
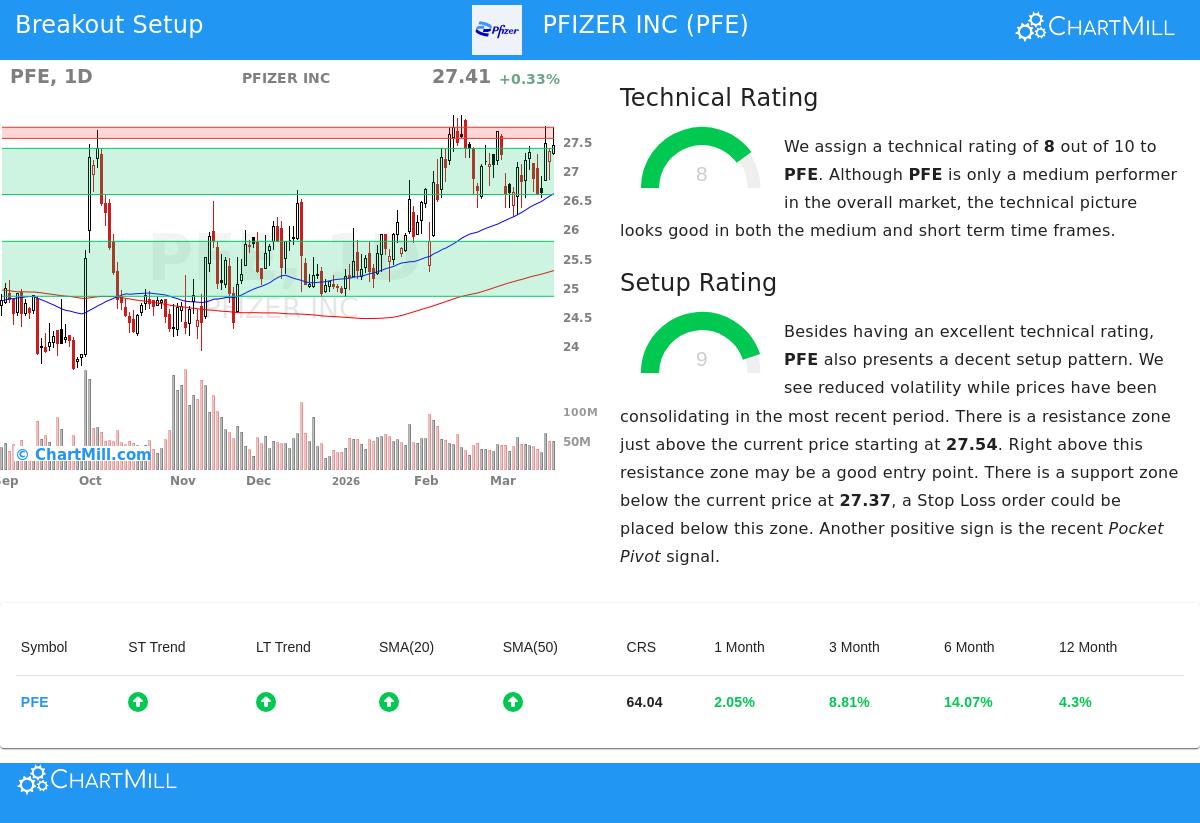
Technical Strength: A Good Base
The first part of the breakout method is finding a stock with good technical health, showing it is in a clear uptrend and not just moving up in a downtrend. Pfizer's ChartMill Technical Rating of 8 out of 10 shows exactly this kind of basic strength. This rating combines many timeframes and indicators to judge the stock's trend and momentum.
Important technical good points for PFE include:
- Positive Trend Agreement: Both the short-term and long-term trends are scored as positive, a unified signal that points to bullish momentum across different timeframes.
- Price Compared to Averages: The stock is trading above all its main simple moving averages (20, 50, 100, and 200-day), and each of these averages is itself in a rising pattern. This layered agreement of support levels is a common sign of a good uptrend.
- Market Outperformance: PFE is now trading near its 52-week high, while the wider S&P 500 is not. This relative strength shows the stock is outperforming the general market, not just following it.
This good technical rating is important because it gives the background for a possible breakout. A breakout from a weak stock is often a false signal or a brief rally. A breakout from a stock already showing trend strength, however, has a better chance of continuing that clear upward path.
Setup Quality: The Pattern for a Possible Move
A strong trend by itself is not a buy signal; entering after a fast rise has the danger of a quick drop. The second part of the method focuses on timing, looking for times of consolidation or "tight" trading that often come before the next upward move. Pfizer's very good Setup Quality Rating of 9 points out such a constructive pattern.
The analysis indicates a stock that has been gathering energy for a possible move:
- Consolidation in a Range: Over the last month, PFE has traded in a fairly tight range between $26.20 and $27.76. This time of lower volatility and sideways movement after a rise lets the stock absorb its gains and can prepare for a new breakout.
- Clear Support and Resistance: The setup finds specific technical levels. A support area exists between $26.58 and $27.37, made by a combination of moving averages and trendlines. Just above the current price, a resistance area is between $27.54 and $27.73. These clear lines help explain the risk and opportunity.
- Good Volume Behavior: The setup report also mentions a recent "Pocket Pivot" signal, a pattern where the stock moves up on volume greater than the largest down-volume day in the recent period. This can be an early indicator of institutional buying during the consolidation.
The high setup score is key as it suggests a lower-risk entry point may be developing. It shows the stock is not overbought but is instead tightening, giving a sensible area to set a stop-loss order below support and a possible entry point just above the clear resistance.
A Clear Technical Situation
From this joined analysis of strength and setup, a specific technical situation is shown. The proposed trade setup involves an entry at $27.74, a level just above the noted resistance area, which would confirm a breakout from the recent consolidation. A stop-loss order is suggested at $26.57, placed below the main support area to control downside risk. This explains a possible risk of about 4.2% on the trade.
It is important to note that this is an example situation created from the technical factors. The breakout must be confirmed by price behavior, and the proposed levels should be reviewed and possibly changed based on an investor's own risk comfort and analysis. Always look for basic catalysts like coming earnings reports that could affect price action.
Locating More Possible Breakouts
Pfizer shows one present example of a stock matching this technical breakout profile. For investors wanting to scan the market for similar chances, the Technical Breakout Setups screen runs this method daily, filtering for stocks with high technical and setup ratings.
Disclaimer: This article is for information only and does not make investment advice, a suggestion, or an offer to buy or sell any security. The technical analysis and trade situations discussed are from past data and automated models, which are not promises of future results. Investing has risk, including the possible loss of principal. Always do your own research and think about your financial position and risk comfort before making any investment choices.