
In the search for stocks with high potential, many investors join detailed technical study with attention to fundamental growth. One noted method is the plan made known by Mark Minervini, which highlights the "SEPA" method, Specific Entry Point Analysis. This plan tries to locate stocks showing firm technical upward movements, backed by strong fundamental drivers such as quickening earnings and sales increases. To put this into practice, investors frequently use filters that join Minervini's Trend Template, which sorts for stocks in clear bullish phases, with measures that identify high-growth momentum. This two-step filtering method intends to separate companies that are both in a firm price movement and have the basic business force that may continue it.
Ondas Holdings Inc (NASDAQ:ONDS) recently appeared from this kind of filtering process, made to find securities that fit both the technical rules of the Trend Template and the fundamental energy needed for high-growth investment.
Technical Fit with the Minervini Trend Template
The Minervini Trend Template gives a strict technical list to confirm a stock is in a verified, long-term upward movement (Stage 2). Its rules are made to screen out weak or consolidating stocks, concentrating only on those showing clear force and agreement across important moving averages. An examination of Ondas Holdings shows it matches these important technical conditions:
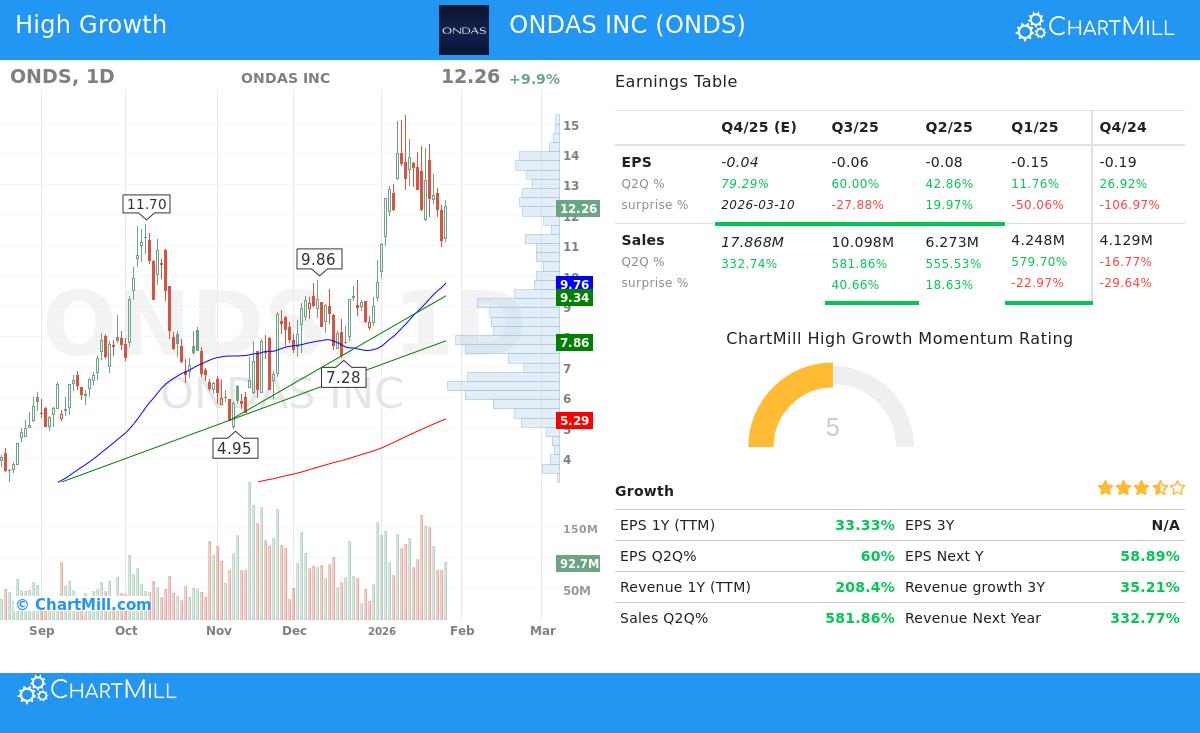
- Price Above Important Moving Averages: The stock's last price of $12.26 trades well above its rising 50-day ($9.76), 150-day ($6.70), and 200-day ($5.29) simple moving averages (SMAs). This agreement is a foundation of the Trend Template, showing continued buying pressure across all related time periods.
- Moving Average Agreement: The 50-day SMA is above both the 150-day and 200-day SMAs, and the 150-day SMA is above the 200-day SMA. This ordered bullish agreement confirms the upward movement's force and quickening momentum, a main idea of Minervini's stage study.
- Nearness to Highs: At $12.26, ONDS is trading within 25% of its 52-week high of $15.28, showing it is acting like a market frontrunner instead of a straggler improving from lows. At the same time, the current price is over 2,000% above its 52-week low of $0.57, meeting the "major recovery" part of the template.
- Better Relative Strength: With a ChartMill Relative Strength (CRS) score of 99.5, ONDS is doing better than almost all other stocks in the market over the past year. Minervini notes that real frontrunners show high relative strength, often coming before and leading wider market moves.
This technical view indicates ONDS is in a firm, confirmed upward movement, passing the first step that Minervini’s plan needs before any fundamental study starts.
Fundamental Drivers for High-Growth Momentum
While the Trend Template makes sure a stock is technically solid, the Minervini SEPA plan gives similar importance to fundamental drivers that can push continued price gains. The "High Growth Momentum" part of the screen looks for companies showing fast improvements in their business measures. Ondas Holdings shows several of these driving features:
- Fast Revenue Growth: The company is showing notable top-line growth. Revenue growth on a trailing twelve-month (TTM) basis is more than 208%. More notably, sales in the newest quarter jumped nearly 582% compared to the same quarter last year. This kind of quickening is a main driver Minervini searches for, as it often draws institutional attention.
- Positive Earnings Path: Although the company is not yet profitable on a net basis (EPS TTM is -$0.48), the direction is quickly getting better. Quarterly earnings per share (EPS) growth is quickening, with the last quarter showing 60% growth year-over-year. Also, analysts are becoming more positive, raising their EPS estimates for the next year by over 4% in the last three months.
- Analyst Belief in Future Growth: The most notable forward-looking sign is the major upward change to revenue estimates. Analysts have increased their sales estimates for the next year by over 40% in the last three months, showing firm belief in the company's growth path and market possibilities.
These fundamental points, quick sales quickening, improving earnings directions, and positive estimate changes, are exactly the kind of drivers that, when joined with a firm technical setup, can lead to major stock price results, fitting exactly with the high-growth momentum investment view.
Combined Technical Health Summary
Beyond the exact Trend Template filters, a wider look at the technical health of ONDS is notable. According to ChartMill's own study, the stock receives a complete Technical Rating of 10 out of 10. This score shows its better performance across many areas, including its long-term positive movement, exceptional relative strength against both the market and its Communications Equipment industry group (where it does better than 100% of stocks), and firm volume liquidity. The report states that while the short-term movement is currently neutral, the stock is consolidating within a wide recent range, which can often come before the next directional move.
For a detailed view of the technical indicators, support levels, and a full study, you can see the complete ChartMill Technical Report for ONDS.
A Subject for More Study
Ondas Holdings shows an example in how joined technical and fundamental filtering can find possible chances. It shows the ruled technical structure required by the Minervini Trend Template and pairs it with the fast revenue growth and positive momentum changes looked for by growth investors. As with any investment method, this finding is only the first stage. The SEPA plan next needs a detailed study of the exact entry point, often searching for volatility contraction patterns (VCPs) and exact breakout levels to improve risk/reward, followed by strict risk management rules.
Want to find other stocks that match similar strict technical and growth conditions? You can look at the filtering settings that found ONDS and see current results by going to the High Growth Momentum + Trend Template screen on ChartMill.
Disclaimer: This article is for information and learning only. It is not a suggestion to buy or sell any security. The study is based on given data and described filtering methods, which have built-in limits. Investment includes risk, including the possible loss of principal. Always do your own complete research and think about your financial position and risk comfort before making any investment choices. Please read our full disclaimer here.