
In the search for stocks with the possibility for major growth, many investors use systematic methods that join strict technical and fundamental study. One such method is supported by well-known trader Mark Minervini, whose SEPA (Specific Entry Point Analysis) plan is made to find market leaders early in their large price increases. The center of this method is the Trend Template, a fixed technical list that confirms a stock is in a strong, confirmed uptrend. However, Minervini states that a good chart by itself is not enough; it must be joined by outstanding core business growth. This pairing, a technically sound setup driven by speeding earnings and sales, is what frequently divides common performers from real super performers. A scanning method that places the Minervini Trend Template together with a filter for strong growth momentum aims to locate these uncommon candidates, where large price possibility rests on a base of large business results.
BEONE MEDICINES LTD-ADR (NASDAQ:ONC) appears as a stock that meets this two-part scanning method. As a global oncology company with a varied pipeline of new cancer treatments, its business basics are being examined next to its price movement. The first question for any Minervini-type study is if the stock's technical position displays the kind of controlled force that usually comes before large breakouts.
Checking the Trend Template Fit
For Mark Minervini, the Trend Template is absolute. It works as a filter, confirming that only stocks displaying clear, multi-timeframe force are reviewed for more study. A stock must satisfy all conditions to pass, as even one miss points to core weakness. A check of ONC's present technical measures shows a strong fit with this template:
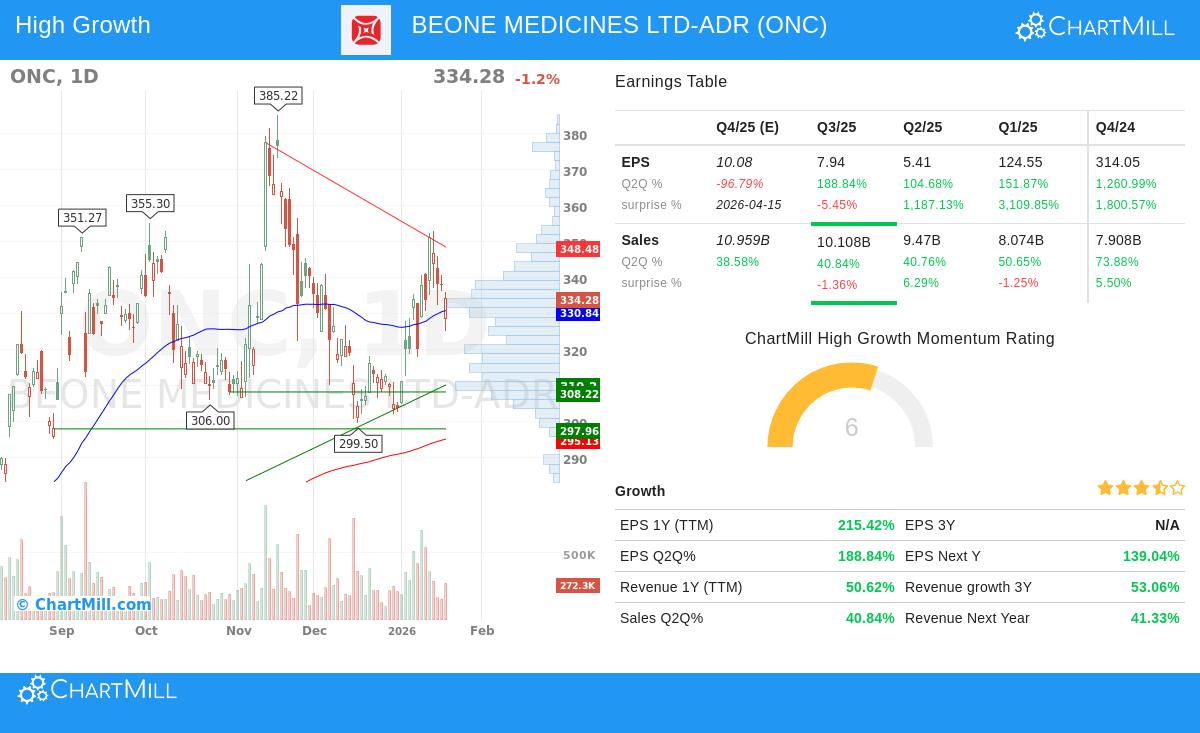
- Price vs. Key Moving Averages: The stock's last price of $334.28 trades well above its 50-day ($330.84), 150-day ($312.76), and 200-day ($295.13) simple moving averages (SMAs). This layered order is a standard mark of a sound Stage 2 uptrend, showing the stock is in a positive stage across short, medium, and long-term periods.
- Moving Average Directions and Order: Importantly, these averages are not just fixed lines but are moving upward. The 200-day SMA has increased from about $294.83, verifying a positive long-term direction. Also, the 50-day SMA sits above both the 150-day and 200-day SMAs, and the 150-day SMA is above the 200-day SMA. This ordered positive arrangement is a central part of the Trend Template, pointing to increasing momentum.
- Nearness to 52-Week Highs and Lows: ONC's price is about 70% above its 52-week low of $196.45, showing major recovery and momentum from its lows. At the same time, it is trading within 13% of its 52-week high of $385.22. Minervini focuses on stocks close to their highs, not their lows, as they are frequently market leaders being bought.
- Better Relative Strength: With a ChartMill Relative Strength (CRS) score of 88.38, ONC is doing better than almost 90% of the whole market. This high relative strength is a sign of leadership, a trait Minervini constantly looks for. It shows that the stock is in strong need independent of wider market changes.
This technical view shows a stock in a verified uptrend, displaying force compared to similar stocks and trading with the traits of a possible leader. The Trend Template's goal is to remove the distraction and find such setups, and ONC seems to pass this first important check.
Reviewing the Strong-Growth Fundamental Driver
A technically correct chart can fail if it is not joined by a strong fundamental account. This is where the "strong growth momentum" part of the scan becomes key. Minervini's work shows that the largest stock market successes are nearly always joined by forceful, and frequently speeding, earnings and sales growth. The given data on BEONE MEDICINES points to a company in a forceful growth stage.
- Large Earnings Growth: The trailing twelve-month (TTM) EPS growth is at an unusual 215.4%. Even more important for momentum investors is the newest quarterly speed increase. The company's last reported quarter showed a year-over-year EPS growth of 188.8%, after a 104.7% rise in the quarter before. This sequence of high, following growth is a main signal for institutional attention.
- Steady Revenue Growth: Top-line growth is similarly solid, with TTM revenue up 50.6%. Recent quarterly sales growth has been steadily forceful at 40.8%, 42.7%, and 50.2% over the last three reported quarters, pointing to continued business momentum.
- Analyst Belief and Performance: The company has exceeded EPS guesses in three of the last four quarters by a large average of over 1,500%, suggesting it is regularly doing better than forecasts. Also, analysts have greatly increased their earnings guesses for the next year by 78.5% over the past three months, showing growing belief in the company's future earnings. This pairing of beating guesses and getting upward changes is a forceful fundamental driver.
These measures show why strong growth is a key filter. Stocks with speeding earnings and sales are the ones that draw the continued buying from big institutional investors, which then feeds the forceful price trends the Trend Template is made to find. ONC's fundamental view suggests it has this kind of driving growth.
Technical Condition and Setup Review
Outside the exact Trend Template conditions, a wider view of the stock's technical condition is positive. ChartMill's own Technical Rating for ONC is a full 10 out of 10, putting it in the top group of all stocks from a technical view. The long-term direction is rated as positive, while the short-term direction is neutral, which can be common during a pause period inside a bigger uptrend.
The technical study report states that the stock has been pausing in a band between about $302 and $353 over the past month, which has helped lower movement. This kind of controlled stop after a rise can create the base for the next step up. The report finds a clear support area around $318-$331 and proposes that a move above resistance near $348.48 could mark a new entry point for traders following a breakout method. You can see the full, complete technical study for ONC here.
Locating Like Chances
For investors focused on using this joined plan of looking for Minervini-type trends driven by strong growth, the scanning method that found ONC can be a beginning point. The scan looks for stocks that meet the strict Trend Template while also holding a high growth momentum score, trying to find leaders early in their growth periods.
To see other stocks now meeting this "High Growth Momentum + Trend Template" scan, you can view the current results here: High Growth Momentum + Trend Template Screen.
Disclaimer: This article is for information and learning only. It is not a suggestion to buy or sell any security. The study is based on given data and a particular investment method. All investing includes risk, including the possible loss of original money. You should do your own complete research, think about your money situation, and talk with a qualified financial advisor before making any investment choices.