
Investors looking to combine strict technical rules with an emphasis on fundamental growth frequently consider methods like the one made popular by Mark Minervini. His plan, called Specific Entry Point Analysis (SEPA), methodically finds stocks showing both strong price movements and improving business foundations. The aim is to find market leaders early in their major price rises by using a two-part check: a firm technical "Trend Template" to verify the stock is in a firm, confirmed uptrend, and a fundamental check for strong growth momentum to confirm the price action is supported by outstanding company results. This method tries to seize the large potential of stocks where better earnings, sales, and market opinion come together with positive chart formations.
BEONE MEDICINES LTD-ADR (NASDAQ:ONC) recently appeared from a screening process made to use this exact thinking. The screen first applies Minervini's Trend Template, a group of fixed technical rules that sort for stocks in a clear Stage 2 advance. Next, it uses a High Growth Momentum (HGM) rating to confirm that the technical strength is supported by firm and improving fundamental growth. ONC's presence on this screen indicates it deserves further examination from growth-focused investors using a trend-following plan.
Checking the Technical Trend: The Minervini Template
The foundation of the first filter is the Minervini Trend Template, which requires agreement across several time periods to confirm a stock is in a strong, lasting uptrend. This removes speculative choices in weak or sideways formations, concentrating capital on issues where the direction of least opposition is clearly upward. A check of ONC's main metrics shows it satisfies these firm technical requirements:
- Price Above Key Moving Averages: The current price trades above the rising 50-day, 150-day, and 200-day simple moving averages (SMAs). This layered agreement shows steady buying pressure across short, medium, and long-term periods.
- Upward-Sloping Long-Term Averages: Both the 150-day and 200-day SMAs have an upward slope, confirming the long-term trend is rising. This is a key filter to avoid stocks in extended downtrends or long pauses.
- Strong Momentum Agreement: The shorter-term 50-day SMA is positioned above both the 150-day and 200-day SMAs, a standard arrangement indicating increasing momentum inside the larger uptrend.
- Nearness to Highs: The stock trades more than 30% above its 52-week low and stays within 25% of its 52-week high. Minervini's work stresses that real market leaders tend to make new highs, not recover from large lows. This rule ensures focus on strength.
- Better Relative Strength: With a ChartMill Relative Strength (CRS) ranking of 74, ONC is performing better than nearly three-quarters of the market. While Minervini often looks for readings above 80 for top choices, a score above 70 still shows notable leadership, a requirement for stocks likely to keep performing better.
Checking the Growth Driver: High Growth Momentum
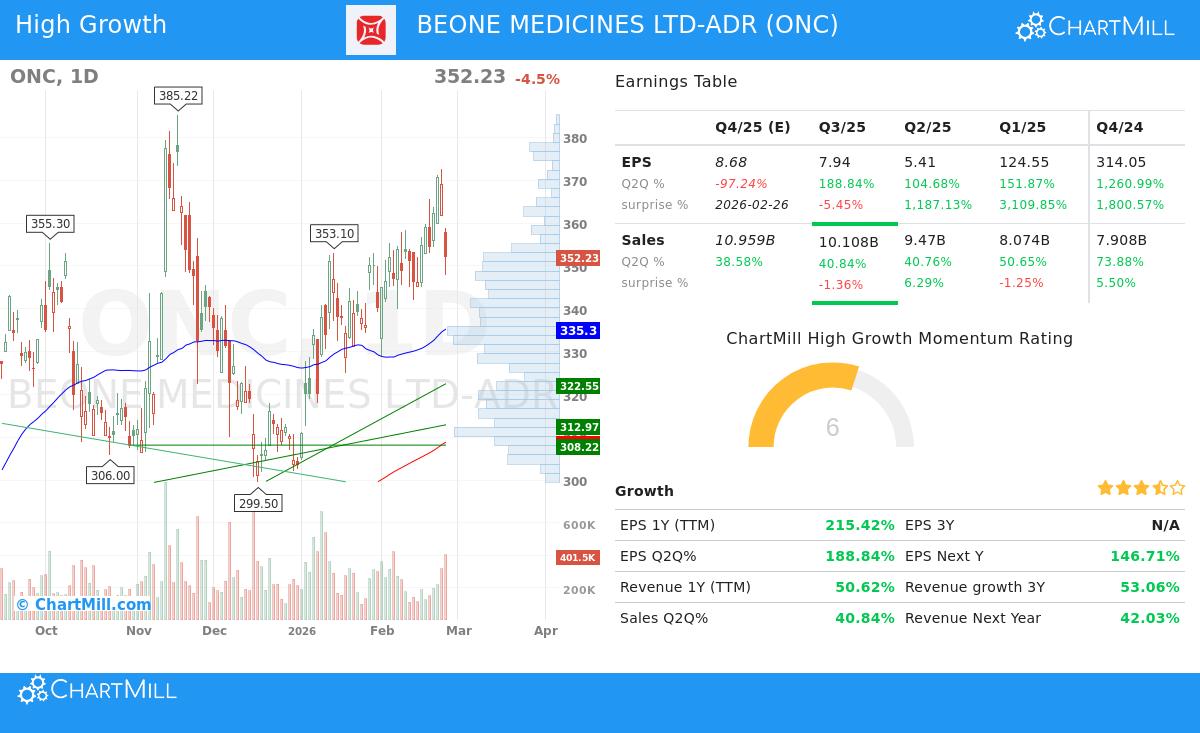
A strong chart is needed but not enough. The SEPA method requires that strong price trends be confirmed by outstanding business performance. This is where the High Growth Momentum rating is used, searching for companies showing large growth in earnings and sales. ONC's fundamental picture shows several positive growth traits:
- Large Earnings Growth: The company's trailing twelve-month (TTM) earnings per share have increased by over 215%. Even more significant is the recent quarterly momentum, with the last reported quarter showing year-over-year EPS growth of nearly 189%. This kind of improvement is exactly what growth investors and the Minervini plan look for, as "big earnings draw big attention" from institutional buyers.
- Firm and Improving Revenue: Top-line growth is also notable, with TTM revenue up over 50%. Recent quarterly sales growth has been consistently firm, ranging from about 41% to 78% over the past year, showing continued demand for the company's products.
- Positive Analyst Opinion: The average analyst estimate for next year's earnings has been adjusted upward by more than 63% over the past three months. Such large upward adjustments are a strong catalyst, often coming before more institutional buying and price gains as expectations are set higher.
- Firm Estimate Performance: The company has surpassed earnings estimates in three of the last four quarters, with an average beat of over 1,500%. This steady record of exceeding expectations builds trust with the market and can be a sign of future positive surprises.
Technical Condition and Setup Summary
Beyond the specific Trend Template filters, ONC's overall technical condition is firm. ChartMill's own Technical Rating gives the stock a score of 8 out of 10, labeling it as being in a solid uptrend. The long-term trend is rated as positive, while the short-term trend is neutral, suggesting the stock may be in a time of pause inside its larger advance.
This pause is shown in the Setup Quality rating of 6, indicating prices have been trading in a range lately. The technical analysis report finds clear support areas below the current price, notably around $340,$341, and resistance near $365,$377. This creates a clear plan for risk management, where a move above resistance could signal the next upward phase, while a break below support would show a possible softening of the current formation.
For a full breakdown of the support and resistance levels, along with a specific trade setup example, you can see the complete ChartMill Technical Analysis Report for ONC.
Conclusion
BEONE MEDICINES LTD-ADR presents a case where a strict, rules-based screening process finds a combination of positive factors. Technically, it meets the disciplined requirements of the Minervini Trend Template, trading in a confirmed uptrend with positive momentum agreement and better relative performance. Fundamentally, it shows the signs of a high-growth company, with large and improving earnings, firm sales growth, and more optimistic analyst opinion. This mix of technical strength and fundamental improvement is exactly what plans like SEPA are made to find, providing a fact-based beginning for more study by growth and momentum investors.
Interested in finding other stocks that satisfy this mix of technical trend strength and high-growth momentum? You can examine the screening rules and see current results by visiting the High Growth Momentum + Trend Template screen on ChartMill.
,
Disclaimer: This article is for informational and educational purposes only. It is not a recommendation to buy or sell any security. The analysis is based on data provided and screening methodologies described. Always conduct your own thorough research, consider your individual financial situation, and consult with a qualified financial advisor before making any investment decisions. Past performance is not indicative of future results.