
Our stock screening tool has identified ON SEMICONDUCTOR (NASDAQ:ON) as an undervalued gem with strong fundamentals. ON boasts decent financial health and profitability while maintaining an attractive price point. We'll break it down further.
Valuation Assessment of ON
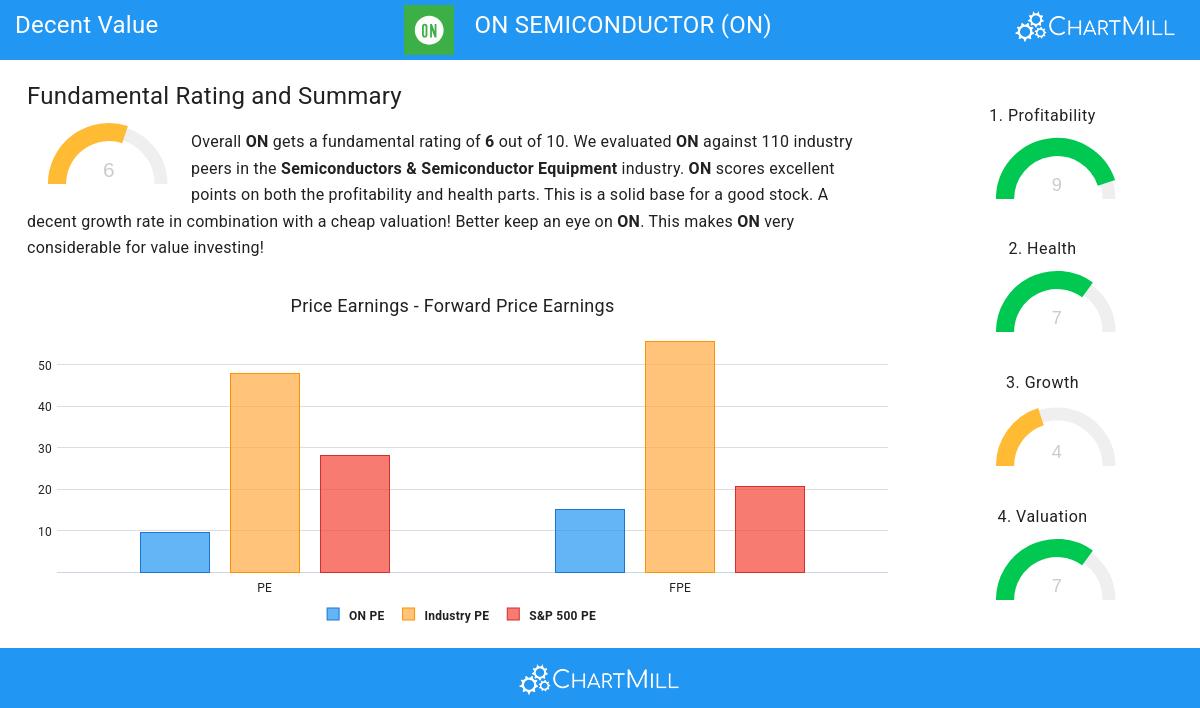
ChartMill assigns a Valuation Rating to each stock, ranging from 0 to 10. This rating is calculated by analyzing different valuation elements, such as price to earnings and free cash flow, both in absolute terms and relative to the market and industry. In the case of ON, the assigned 7 reflects its valuation:
- ON is valuated reasonably with a Price/Earnings ratio of 9.65.
- Compared to the rest of the industry, the Price/Earnings ratio of ON indicates a rather cheap valuation: ON is cheaper than 92.73% of the companies listed in the same industry.
- ON is valuated cheaply when we compare the Price/Earnings ratio to 28.10, which is the current average of the S&P500 Index.
- Based on the Price/Forward Earnings ratio, ON is valued a bit cheaper than 75.45% of the companies in the same industry.
- Compared to an average S&P500 Price/Forward Earnings ratio of 20.74, ON is valued a bit cheaper.
- Compared to the rest of the industry, the Enterprise Value to EBITDA ratio of ON indicates a rather cheap valuation: ON is cheaper than 89.09% of the companies listed in the same industry.
- Based on the Price/Free Cash Flow ratio, ON is valued cheaply inside the industry as 90.91% of the companies are valued more expensively.
- The excellent profitability rating of ON may justify a higher PE ratio.
What does the Profitability looks like for ON
ChartMill utilizes a Profitability Rating to assess stocks, scoring them on a scale of 0 to 10. This rating takes into account a variety of profitability ratios and margins, both in absolute terms and in comparison to industry peers. ON has earned a 9 out of 10:
- ON has a Return On Assets of 11.16%. This is amongst the best in the industry. ON outperforms 81.82% of its industry peers.
- ON's Return On Equity of 17.88% is amongst the best of the industry. ON outperforms 81.82% of its industry peers.
- Looking at the Return On Invested Capital, with a value of 12.81%, ON belongs to the top of the industry, outperforming 84.55% of the companies in the same industry.
- The Average Return On Invested Capital over the past 3 years for ON is significantly above the industry average of 11.19%.
- The last Return On Invested Capital (12.81%) for ON is well below the 3 year average (19.04%), which needs to be investigated, but indicates that ON had better years and this may not be a problem.
- ON has a Profit Margin of 22.21%. This is amongst the best in the industry. ON outperforms 84.55% of its industry peers.
- In the last couple of years the Profit Margin of ON has grown nicely.
- ON has a Operating Margin of 26.85%. This is amongst the best in the industry. ON outperforms 86.36% of its industry peers.
- ON's Operating Margin has improved in the last couple of years.
- ON's Gross Margin has improved in the last couple of years.
Health Analysis for ON
To gauge a stock's financial health, ChartMill utilizes a Health Rating on a scale of 0 to 10. This comprehensive evaluation encompasses liquidity and solvency, both in absolute terms and in comparison to industry peers. ON has earned a 7 out of 10:
- ON has an Altman-Z score of 4.22. This indicates that ON is financially healthy and has little risk of bankruptcy at the moment.
- ON has a debt to FCF ratio of 2.78. This is a good value and a sign of high solvency as ON would need 2.78 years to pay back of all of its debts.
- The Debt to FCF ratio of ON (2.78) is better than 66.36% of its industry peers.
- ON has a Debt/Equity ratio of 0.38. This is a healthy value indicating a solid balance between debt and equity.
- ON has a Current Ratio of 5.06. This indicates that ON is financially healthy and has no problem in meeting its short term obligations.
- The Current ratio of ON (5.06) is better than 74.55% of its industry peers.
- A Quick Ratio of 3.38 indicates that ON has no problem at all paying its short term obligations.
- With a decent Quick ratio value of 3.38, ON is doing good in the industry, outperforming 64.55% of the companies in the same industry.
Unpacking ON's Growth Rating
ChartMill assigns a proprietary Growth Rating to each stock. The score is computed by evaluating various growth aspects, like EPS and revenue growth. We take into account the history as well as the estimated future numbers. ON was assigned a score of 4 for growth:
- The Earnings Per Share has been growing by 21.88% on average over the past years. This is a very strong growth
- ON is expected to show quite a strong growth in Earnings Per Share. In the coming years, the EPS will grow by 10.02% yearly.
Our Decent Value screener lists more Decent Value stocks and is updated daily.
Check the latest full fundamental report of ON for a complete fundamental analysis.
Disclaimer
This is not investing advice! The article highlights some of the observations at the time of writing, but you should always make your own analysis and invest based on your own insights.