
Investors aiming to benefit from large price gains often use a method that combines fundamental soundness with technical timing. One such tactic looks for stocks that show good core growth traits, consistent sales and profit increases, firm profitability, and a strong financial position, while also displaying a positive technical chart formation hinting at a possible breakout. This technique tries to find companies with the fundamental capacity to create lasting value, just as they are building technical steam for a nearer-term price rise. The objective is to locate chances where better business basics might be about to be acknowledged by the wider market, as seen in the stock's price movement.
Ollie's Bargain Outlet Holdings (NASDAQ:OLLI) recently appeared from this kind of screening. The deep-discount retailer, famous for its "Good Stuff Cheap" slogan, runs an increasing chain of more than 575 stores in 31 states. Its way of buying surplus stock and closeout goods places it in a special spot in the retail sector, frequently drawing shoppers looking for value. An examination of its fundamental and technical picture shows why it might meet the standards of a good growth stock showing a technical formation.
Fundamental Growth Review
The heart of this tactic starts with finding companies showing better growth possibility, a main force for future stock price gains. According to the fundamental analysis report for OLLI, the company gets a firm Growth Rating of 7 out of 10. This score is backed by clear financial results:
- Revenue Growth: The company has demonstrated steady top-line growth, with revenue increasing 12.58% over the last year and averaging 10.04% yearly growth over recent years. Analysts forecast this trend to keep going, with predicted average yearly revenue growth of 13.47% in the next years.
- Earnings Growth: Earnings per share (EPS) growth is similarly solid, having risen by 11.18% last year. The growth pace is forecast to speed up, with future EPS projected to grow at an average yearly rate of 16.32%.
- Speeding Up Path: Importantly, the report states that both the EPS and revenue growth rates are speeding up, showing the business trend is getting better, not weaker.
Beyond just growth, the tactic needs "acceptable profitability and condition" to make sure the growth is lasting and not on unsound financial ground. OLLI's fundamentals meet these points:
- Profitability: With a Profitability Rating of 6, the company keeps good margins. Its operating margin of 10.89% and return on equity of 12.20% do better than a large portion of its competitors in the broadline retail industry.
- Financial Condition: The company stands out regarding financial steadiness, getting a Health Rating of 7. It has a very strong balance sheet with almost no debt (Debt/Equity ratio of 0.00) and a high Altman-Z score, showing very little bankruptcy risk. This financial strength gives it wide room to pay for its store growth and handle economic changes.
Technical Formation and Breakout Chance
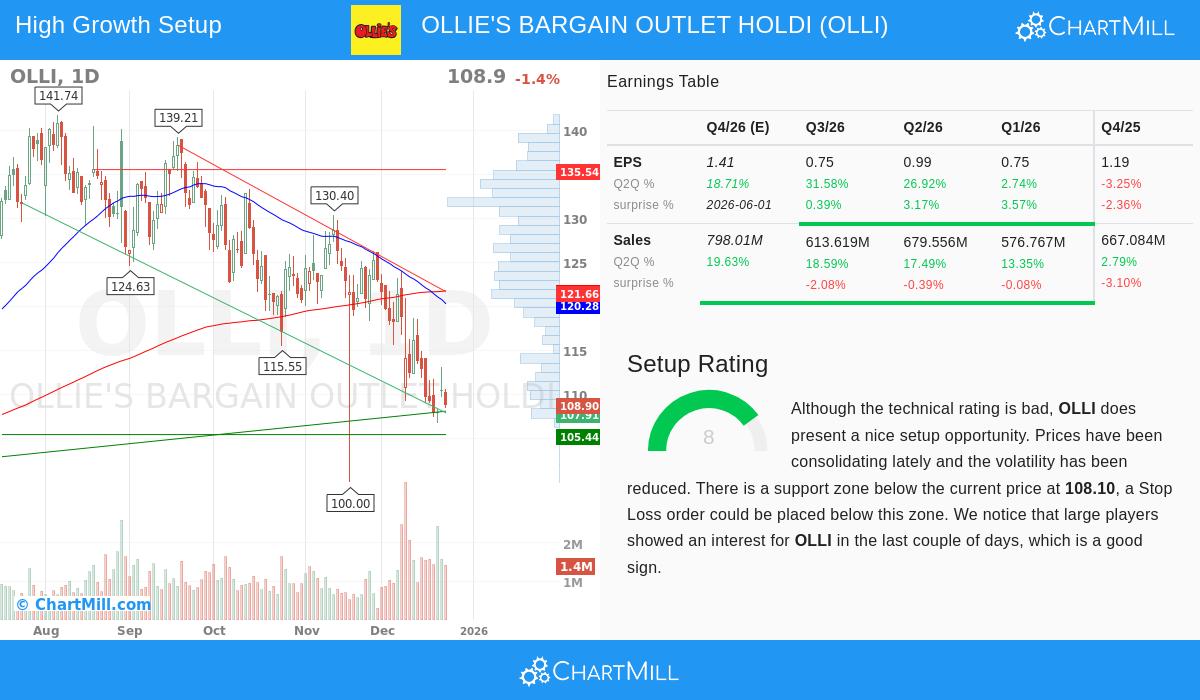
While sound fundamentals give the "reason" for a stock's possibility, technical analysis aids in spotting the "timing" by studying price formations and market sentiment. OLLI's technical analysis report shows a stock that has been under stress but is now displaying signals of a base that could come before a turn.
The total technical rating is poor, showing a negative short-term and long-term direction where the stock has fallen behind the wider market. However, the tactic particularly searches for breakout formations inside such settings, and OLLI's Setup Rating is a high 8 out of 10. This points to a possibly good risk/reward arrangement for traders expecting a shift in direction.
Important technical notes include:
- Basing and Lowered Volatility: The report states that prices have been basing recently, with volatility going down. This often happens before a notable price shift, as uncertainty is settled.
- Clear Support Area: A distinct and key support area has been set between about $107.96 and $108.10, made by several trendlines across time periods. This gives a sensible level for placing stop-loss orders, setting the risk on a possible long trade.
- Resistance Above: The stock meets close resistance in the $119-$122 range. A continued breakout above this area on high volume could mark the start of a new upward direction, confirming the technical formation.
- Big Player Interest: The report points out clear buying activity from large investors in recent days, as measured by the Effective Volume indicator. This can be a sign of a wider move, as big player buying often comes before price gains.
Strategic Logic and Points
The mix of OLLI's pictures creates a story that fits the screening tactic. The company's speeding fundamental growth and very sound financial condition represent the qualitative and quantitative "drive" for long-term better performance. At the same time, the present technical view suggests the stock might be finishing a time of drop or basing. The high setup rating means that, from a chart view, the stock is tightening in a way that often comes before a directional shift.
For investors using this method, the idea would be that the market might be pricing OLLI's growth path and clean balance sheet too low. A technical breakout above key resistance could be the event that makes this fundamental strength noticed again, leading to a re-pricing of the stock. The clear support level allows for a controlled entry with a set point of failure if the expected breakout does not happen.
Locating Comparable Chances
Ollie's Bargain Outlet offers an example of how growth fundamentals can match a positive technical pattern. For investors wanting to use this approach to find other possible chances, the screen that found OLLI is available here. This tool sorts the market for stocks displaying high growth ratings, acceptable profitability and condition, together with high technical setup scores.
Disclaimer: This article is for information only and is not financial advice, a suggestion, or a deal to buy or sell any security. Investing has risk, including the possible loss of original money. The fundamental and technical information shown are from reports on ChartMill.com and can change. Investors should do their own full study and think about their personal money situation and risk comfort before making any investment choices. Past results of a security or tactic are not a promise of future results.