
For investors using technical analysis to find possible opportunities, the search usually focuses on two main questions: which stock to buy and when to buy it. A methodical way to answer these questions includes looking for stocks that are both technically sound and creating a favorable price pattern, or setup, for a possible breakout. This technique joins a high "Technical Rating," which measures the general condition and direction of a stock, with a high "Setup Rating," which finds times of sideways movement that might come before the next notable price change. The aim is to locate market leaders that are resting, giving a more distinct entry point with clear risk, instead of following stocks that have already made large advances.
Omega Healthcare Investors (NYSE:OHI), a real estate investment trust (REIT) in the healthcare industry, recently appeared from this kind of screening process. The stock offers a noteworthy case for technical investors, as shown in its ChartMill Technical Report, by displaying solid basic strength paired with a high-grade setup pattern.
Technical Strength: A Firm Base
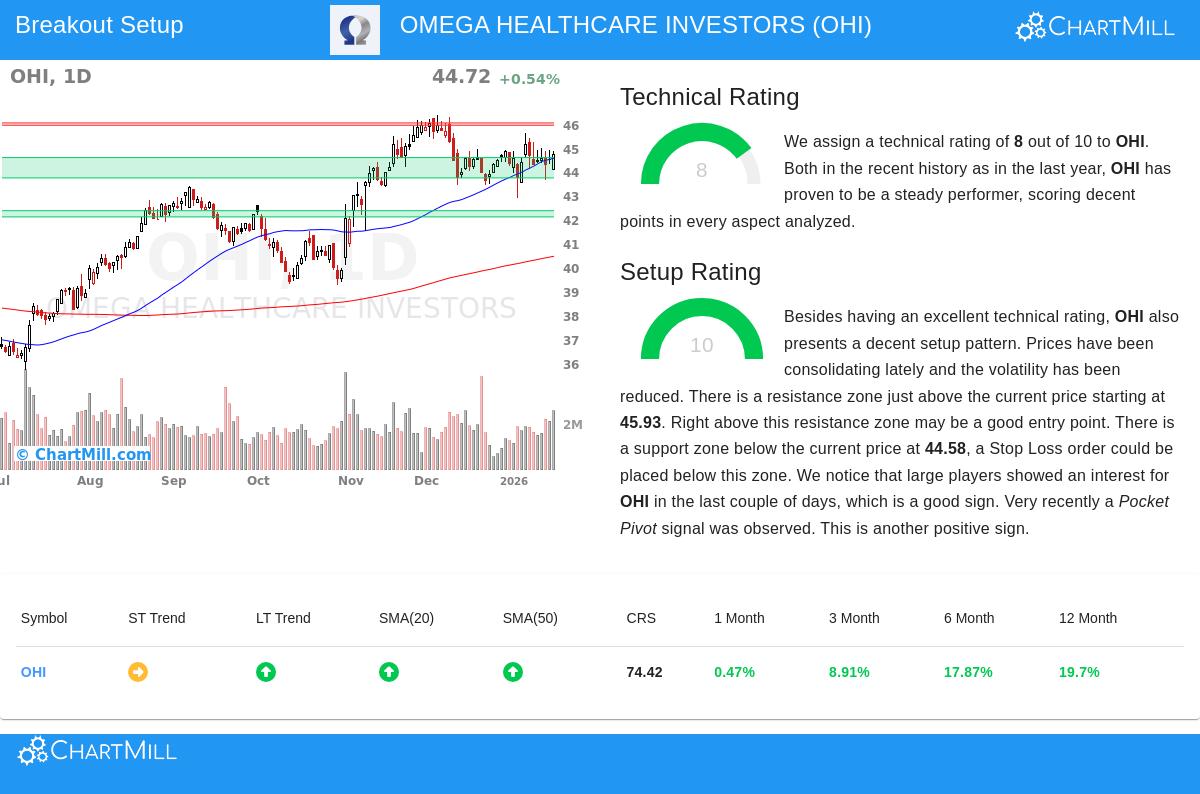
The base of any breakout candidate is a good and continuing basic trend. Omega Healthcare Investors receives a Technical Rating of 8 out of 10, showing it is in a verified uptrend. This rating does not come from one single measure but from a group of factors that create a view of continued strength.
- Long-Term Trend: The long-term trend is rated as good, which is the most important part for trend-based methods. This is supported by the stock's place compared to its important moving averages; it is trading above its rising 20, 50, 100, and 200-day simple moving averages.
- Relative Performance: OHI is doing better than a large part of the wider market. It has shown stronger performance over the last year than about 74% of all stocks and is ahead of 80% of similar companies in the Diversified REITs industry.
- Steady Momentum: The report mentions a "good and steady pattern of increasing prices" over several time periods. This is shown by solid multi-month performance, with increases of about 8.9% over three months and close to 18% over six months.
This mix of factors means the stock is not just having a short-lived rise but is showing the kind of stable, leading-quality momentum that technical investors look for before thinking about an entry. A high Technical Rating answers the "which stock" question by sorting for assets with a greater chance of continuing their current direction.
Setup Quality: The Timing Tool
While a solid trend is needed, it is not enough for a best entry. Buying a stock that is technically sound but "stretched" in price often results in quick declines. This is where the Setup Rating becomes key, dealing with the "when to buy" question. Omega Healthcare Investors gets a perfect 10 in this group, meaning a very clear sideways pattern.
- Price Sideways Movement: Over the last month, OHI has been trading inside a set range ($42.90 - $45.62), and it is currently moving sideways in the middle of this range. This time of lower volatility and flat movement after a rise is typical behavior that can come before a new upward move.
- Clear Support and Resistance: The setup shows clear technical levels for risk control. An important support area is found between $43.73 and $44.58, made by a mix of trendlines and moving averages. Just above the current price, a resistance area is between $45.93 and $46.03.
- Favorable Signals: Other good technical signals include noted activity from large traders (as seen in volume study) and a recent "Pocket Pivot" signal, which is a price and volume pattern often linked to institutional buying.
This high-grade setup allows for a planned trading approach. The study suggests a possible breakout entry point just above the resistance area at $46.04, with a stop-loss order set below the support area near $43.72. This framework gives a clear, rule-based method for entering the existing uptrend.
Conclusion
Omega Healthcare Investors shows the kind of opportunity technical breakout screens are made to find. The stock has the two credentials looked for by this method: a high Technical Rating (8) confirming its part in a continued uptrend, and a top Setup Rating (10) meaning it is coming out of a tight sideways period with well-set risk limits. For investors using trend-based or breakout methods, OHI presents a situation where the "what" and "when" match, offering a framed opportunity within the wider positive trend of the healthcare REIT.
Looking for more possible breakout setups? You can use the same screen that found OHI to find other technically sound stocks making favorable patterns. See the present list of candidates in the Technical Breakout Setups screener.
Disclaimer: This article is for information only and is not investment advice, a suggestion, or an offer or request to buy or sell any securities. The study shown is based on technical indicators and past data, which are not assurances of future results. Investors should do their own study and think about their personal money situation before making any investment choices. Trading securities has risk, including the possible loss of initial funds.