
For investors looking for reliable income, a disciplined screening method can help find companies that provide more than a high stated yield. One useful tactic is to sort for stocks with a good total dividend profile, as judged by a full rating system, while also checking the core business is profitable and financially stable. This technique focuses on longevity over high yield alone, trying to find companies able to keep and possibly raise their payments over time. A clear example found through such a screen is Novo Nordisk A/S-Spons ADR (NYSE:NVO).
A Notable Dividend Profile
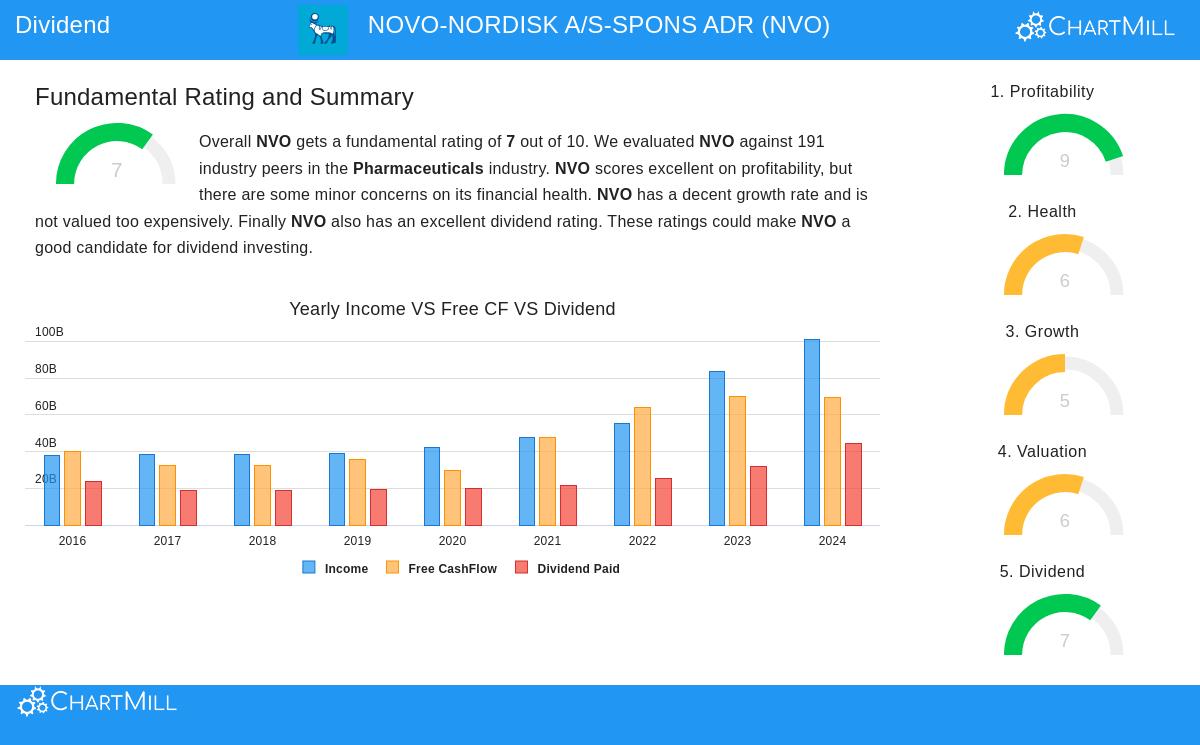
Novo Nordisk gets a solid ChartMill Dividend Rating of 7, putting it in the higher group of dividend-paying stocks. This rating combines a few main points important for income investors. The company gives a good yield of 3.19%, which is higher than both the industry average of 0.40% and the wider S&P 500 average. Significantly, Novo Nordisk shows a very good history of dividend growth, with an average yearly rise of 16.56% over the past five years. The company has paid dividends for more than ten years and has not lowered its payment in the last five years, showing a clear dedication to giving capital back to shareholders. This mix of a good yield and fast growth is a strong beginning for any dividend portfolio.
Profitability, The Source for Payments
A lasting dividend needs to be paid for by a profitable business, and here Novo Nordisk does very well. The company has a top ChartMill Profitability Rating of 9, showing first-rate operational results. Important measures highlight this:
- High Returns: A Return on Invested Capital (ROIC) of 38.03% and a Return on Equity (ROE) of 61.08% are near the top in the pharmaceuticals industry, showing very efficient use of capital.
- Good Margins: With a Profit Margin of 32.88% and an Operating Margin of 42.03%, the company keeps a large part of its revenue as profit, giving a good cushion for dividend payments. This high profitability is central to the dividend screening method. A company creating high returns on capital has the financial means to pay shareholder distributions without risking future expansion or financial health.
Financial Health, Checking the Base
While the dividend and profitability scores are high, a full review needs a look at the company's financial strength. Novo Nordisk gets a ChartMill Health Rating of 6, showing an acceptable but varied financial state. The review shows clear positives next to points to watch.
- Solvency Positives: The company has an Altman-Z score of 4.93, which points to a very small short-term chance of financial trouble. Its Debt to Free Cash Flow ratio is a very good 1.66, meaning it could pay off all its debt with under two years of cash flow.
- Liquidity Note: The report mentions lower current and quick ratios, which are typical in some business models in the pharmaceuticals sector. Still, given the company's better profitability and solvency measures, these liquidity ratios are seen with that in mind and not viewed as a major danger to current activities. For a dividend screening method, an acceptable health rating is an important filter. It helps steer clear of companies where high yields could be hiding balance sheet pressure that might later lead to a dividend reduction.
Valuation and Growth Setting
From a valuation view, Novo Nordisk seems fairly priced compared to its industry, trading below many peers on measures like Price/Earnings and Price/Free Cash Flow. Its growth history has been notable, with large past rises in both revenue and earnings per share. Analysts, though, expect a slowing in this growth rate in the future. This expected slowdown is a main point for dividend investors to consider, as future dividend growth is often linked to earnings growth. The company's payout ratio of about 50% is workable but does need steady earnings to support.
A Full Fundamental Picture
The combined information shows a high-quality, dividend-growing company. Novo Nordisk's good profitability pays for its shareholder returns, while its acceptable solvency gives a base for longevity. Investors can see the detailed fundamental review that backs these ratings in the full ChartMill Fundamental Report for NVO.
For investors wanting to use this disciplined way to find other possible choices, the "Best Dividend Stocks" screen that identified Novo Nordisk is a helpful starting place. You can see the current screen results and change the filters to your own needs via this link.
Disclaimer: This article is for informational purposes only and does not constitute financial advice, a recommendation, or an offer or solicitation to buy or sell any securities. The analysis is based on current data and ratings, which are subject to change. Investors should conduct their own research and consider their individual financial circumstances before making any investment decisions.