
Discover NOVO-NORDISK A/S-SPONS ADR (NYSE:NVO), an undervalued growth gem identified by our stock screener. NVO is shining in terms of growth metrics, and it's also displaying strong financial health and profitability. What's more, it retains an appealing valuation. We'll break it down further.
What does the Growth looks like for NVO
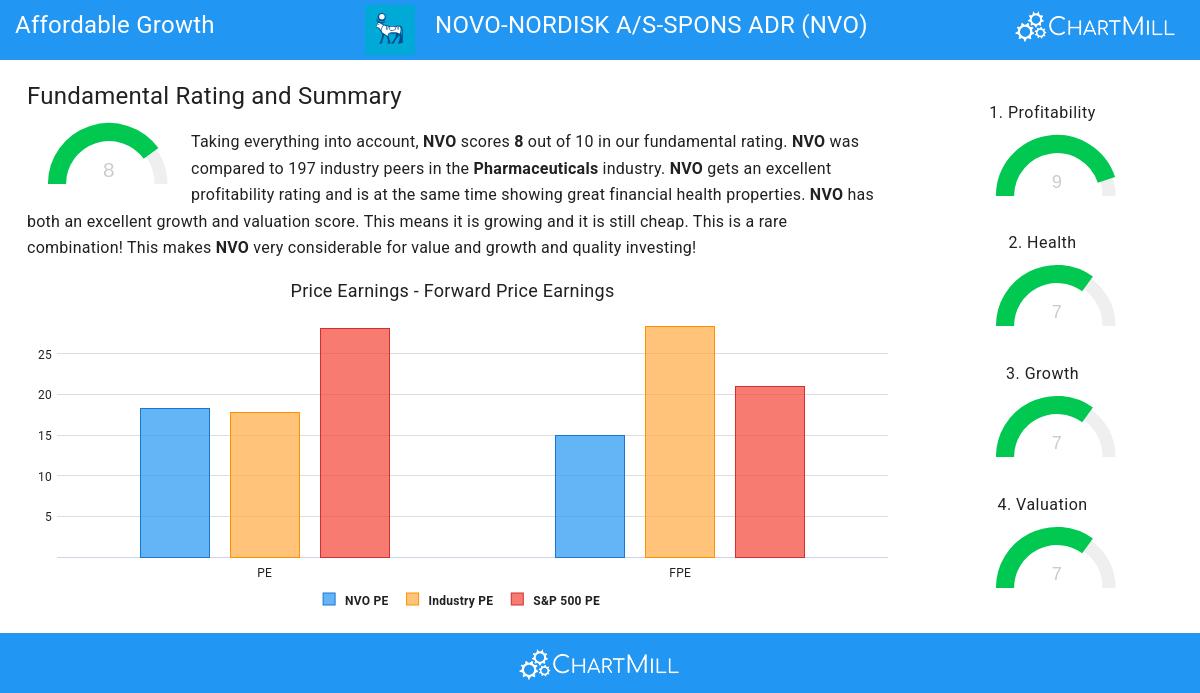
ChartMill assigns a proprietary Growth Rating to each stock. The score is computed by evaluating various growth aspects, like EPS and revenue growth. We take into account the history as well as the estimated future numbers. NVO was assigned a score of 7 for growth:
- NVO shows a strong growth in Earnings Per Share. In the last year, the EPS has been growing by 21.57%, which is quite impressive.
- NVO shows a strong growth in Revenue. In the last year, the Revenue has grown by 25.03%.
- NVO shows quite a strong growth in Revenue. Measured over the last years, the Revenue has been growing by 18.94% yearly.
- NVO is expected to show quite a strong growth in Earnings Per Share. In the coming years, the EPS will grow by 13.97% yearly.
- Based on estimates for the next years, NVO will show a quite strong growth in Revenue. The Revenue will grow by 12.68% on average per year.
- The EPS growth rate is accelerating: in the next years the growth will be better than in the last years.
Valuation Insights: NVO
ChartMill provides a Valuation Rating to every stock, ranging from 0 to 10. This rating assesses various valuation aspects, comparing price to earnings and cash flows, while considering factors like profitability and growth. NVO boasts a 7 out of 10:
- Based on the Price/Earnings ratio, NVO is valued cheaply inside the industry as 83.76% of the companies are valued more expensively.
- NVO is valuated rather cheaply when we compare the Price/Earnings ratio to 28.13, which is the current average of the S&P500 Index.
- 83.76% of the companies in the same industry are more expensive than NVO, based on the Price/Forward Earnings ratio.
- The average S&P500 Price/Forward Earnings ratio is at 21.03. NVO is valued slightly cheaper when compared to this.
- Compared to the rest of the industry, the Enterprise Value to EBITDA ratio of NVO indicates a rather cheap valuation: NVO is cheaper than 81.73% of the companies listed in the same industry.
- Compared to the rest of the industry, the Price/Free Cash Flow ratio of NVO indicates a rather cheap valuation: NVO is cheaper than 81.73% of the companies listed in the same industry.
- The low PEG Ratio(NY), which compensates the Price/Earnings for growth, indicates a rather cheap valuation of the company.
- NVO has an outstanding profitability rating, which may justify a higher PE ratio.
- A more expensive valuation may be justified as NVO's earnings are expected to grow with 19.38% in the coming years.
Health Analysis for NVO
ChartMill assigns a Health Rating to every stock. This score ranges from 0 to 10 and evaluates the different health aspects like liquidity and solvency, both absolutely, but also relative to the industry peers. NVO scores a 7 out of 10:
- An Altman-Z score of 5.27 indicates that NVO is not in any danger for bankruptcy at the moment.
- With an excellent Altman-Z score value of 5.27, NVO belongs to the best of the industry, outperforming 85.79% of the companies in the same industry.
- The Debt to FCF ratio of NVO is 1.48, which is an excellent value as it means it would take NVO, only 1.48 years of fcf income to pay off all of its debts.
- NVO's Debt to FCF ratio of 1.48 is amongst the best of the industry. NVO outperforms 94.42% of its industry peers.
- Even though the debt/equity ratio score it not favorable for NVO, it has very limited outstanding debt, so we won't put too much weight on the DE evaluation.
- The current and quick ratio evaluation for NVO is rather negative, while it does have excellent solvency and profitability. These ratios do not necessarly indicate liquidity issues and need to be evaluated against the specifics of the business.
Exploring NVO's Profitability
ChartMill utilizes a Profitability Rating to assess stocks, scoring them on a scale of 0 to 10. This rating takes into account a variety of profitability ratios and margins, both in absolute terms and in comparison to industry peers. NVO has earned a 9 out of 10:
- NVO has a better Return On Assets (21.68%) than 98.48% of its industry peers.
- The Return On Equity of NVO (70.38%) is better than 98.48% of its industry peers.
- NVO has a better Return On Invested Capital (43.02%) than 97.97% of its industry peers.
- NVO had an Average Return On Invested Capital over the past 3 years of 50.29%. This is significantly above the industry average of 40.40%.
- The last Return On Invested Capital (43.02%) for NVO is well below the 3 year average (50.29%), which needs to be investigated, but indicates that NVO had better years and this may not be a problem.
- NVO's Profit Margin of 34.78% is amongst the best of the industry. NVO outperforms 97.46% of its industry peers.
- NVO's Profit Margin has improved in the last couple of years.
- NVO has a better Operating Margin (46.16%) than 97.97% of its industry peers.
- In the last couple of years the Operating Margin of NVO has grown nicely.
- With an excellent Gross Margin value of 84.67%, NVO belongs to the best of the industry, outperforming 89.34% of the companies in the same industry.
Every day, new Affordable Growth stocks can be found on ChartMill in our Affordable Growth screener.
Check the latest full fundamental report of NVO for a complete fundamental analysis.
Keep in mind
Important Note: The content of this article is not intended as trading advice. It is essential to perform your own analysis and exercise caution when making trading decisions. The article presents observations created by automated analysis but does not guarantee any trading or investment outcomes. Always trade responsibly and make independent judgments.