
Our stock screener has singled out NOVO-NORDISK A/S-SPONS ADR (NYSE:NVO) as an attractive growth opportunity. NVO is demonstrating remarkable growth potential while maintaining strong financial indicators, making it a reasonably priced option. We'll explore this further.
ChartMill's Evaluation of Growth
Every stock receives a Growth Rating from ChartMill, ranging from 0 to 10. This rating assesses various growth aspects, including historical and projected EPS and revenue growth. NVO boasts a 7 out of 10:
- The Earnings Per Share has grown by an impressive 21.57% over the past year.
- NVO shows a strong growth in Revenue. In the last year, the Revenue has grown by 25.03%.
- Measured over the past years, NVO shows a quite strong growth in Revenue. The Revenue has been growing by 18.94% on average per year.
- The Earnings Per Share is expected to grow by 14.16% on average over the next years. This is quite good.
- Based on estimates for the next years, NVO will show a quite strong growth in Revenue. The Revenue will grow by 12.34% on average per year.
- When comparing the EPS growth rate of the last years to the growth rate of the upcoming years, we see that the growth is accelerating.
Assessing Valuation Metrics for NVO
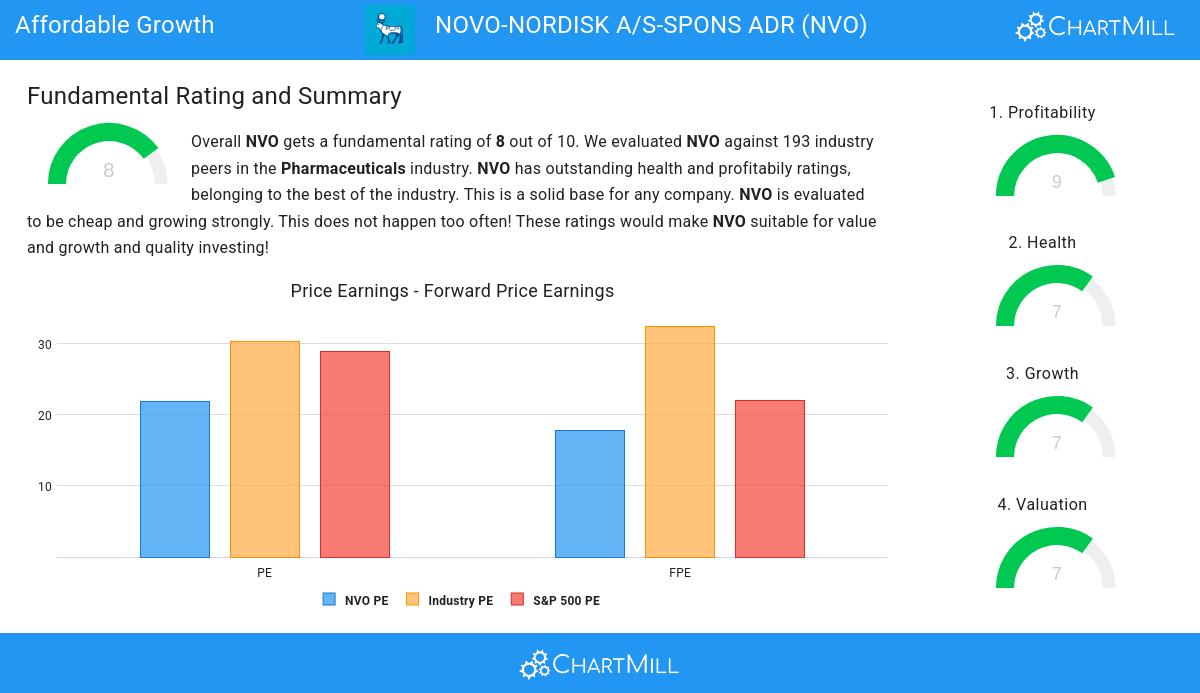
ChartMill assigns a Valuation Rating to each stock, ranging from 0 to 10. This rating is calculated by analyzing different valuation elements, such as price to earnings and free cash flow, both in absolute terms and relative to the market and industry. In the case of NVO, the assigned 7 reflects its valuation:
- Compared to the rest of the industry, the Price/Earnings ratio of NVO indicates a rather cheap valuation: NVO is cheaper than 81.87% of the companies listed in the same industry.
- When comparing the Price/Earnings ratio of NVO to the average of the S&P500 Index (28.89), we can say NVO is valued slightly cheaper.
- Based on the Price/Forward Earnings ratio, NVO is valued cheaply inside the industry as 80.31% of the companies are valued more expensively.
- Compared to the rest of the industry, the Enterprise Value to EBITDA ratio of NVO indicates a rather cheap valuation: NVO is cheaper than 80.83% of the companies listed in the same industry.
- Based on the Price/Free Cash Flow ratio, NVO is valued cheaper than 81.35% of the companies in the same industry.
- NVO's low PEG Ratio(NY), which compensates the Price/Earnings for growth, indicates a rather cheap valuation of the company.
- NVO has an outstanding profitability rating, which may justify a higher PE ratio.
- NVO's earnings are expected to grow with 19.33% in the coming years. This may justify a more expensive valuation.
Evaluating Health: NVO
ChartMill utilizes a Health Rating to assess stocks, scoring them on a scale of 0 to 10. This rating takes into account a variety of liquidity and solvency ratios, both in absolute terms and in comparison to industry peers. NVO has earned a 7 out of 10:
- NVO has an Altman-Z score of 5.96. This indicates that NVO is financially healthy and has little risk of bankruptcy at the moment.
- Looking at the Altman-Z score, with a value of 5.96, NVO belongs to the top of the industry, outperforming 84.46% of the companies in the same industry.
- The Debt to FCF ratio of NVO is 1.48, which is an excellent value as it means it would take NVO, only 1.48 years of fcf income to pay off all of its debts.
- Looking at the Debt to FCF ratio, with a value of 1.48, NVO belongs to the top of the industry, outperforming 95.34% of the companies in the same industry.
- Even though the debt/equity ratio score it not favorable for NVO, it has very limited outstanding debt, so we won't put too much weight on the DE evaluation.
- The current and quick ratio evaluation for NVO is rather negative, while it does have excellent solvency and profitability. These ratios do not necessarly indicate liquidity issues and need to be evaluated against the specifics of the business.
Analyzing Profitability Metrics
ChartMill assigns a proprietary Profitability Rating to each stock. The score is computed by evaluating various profitability ratios and margins and ranges from 0 to 10. NVO was assigned a score of 9 for profitability:
- The Return On Assets of NVO (21.68%) is better than 98.45% of its industry peers.
- NVO's Return On Equity of 70.38% is amongst the best of the industry. NVO outperforms 98.45% of its industry peers.
- NVO has a better Return On Invested Capital (43.02%) than 97.93% of its industry peers.
- Measured over the past 3 years, the Average Return On Invested Capital for NVO is significantly above the industry average of 43.55%.
- The 3 year average ROIC (50.29%) for NVO is well above the current ROIC(43.02%). The reason for the recent decline needs to be investigated.
- With an excellent Profit Margin value of 34.78%, NVO belongs to the best of the industry, outperforming 96.37% of the companies in the same industry.
- NVO's Profit Margin has improved in the last couple of years.
- Looking at the Operating Margin, with a value of 46.16%, NVO belongs to the top of the industry, outperforming 97.93% of the companies in the same industry.
- In the last couple of years the Operating Margin of NVO has grown nicely.
- The Gross Margin of NVO (84.67%) is better than 90.16% of its industry peers.
Every day, new Affordable Growth stocks can be found on ChartMill in our Affordable Growth screener.
For an up to date full fundamental analysis you can check the fundamental report of NVO
Keep in mind
This article should in no way be interpreted as advice. The article is based on the observed metrics at the time of writing, but you should always make your own analysis and trade or invest at your own responsibility.


