
For investors looking for a methodical way to find leading companies with high growth, the CANSLIM method, created by William O’Neil, provides a structured system. This approach mixes detailed examination of company finances with important chart-based signals to find stocks with powerful profit trends, better price performance than most, and support from large investment firms, all while considering a positive overall market environment. The aim is to locate firms not only with excellent financial statements, but with the market approval and chart pattern that indicate continued price increases.
A recent filter using main CANSLIM rules has identified NVIDIA CORP (NASDAQ:NVDA) as a leading example. The chipmaker's huge expansion, fueled by its key position in artificial intelligence and high-performance computing, seems to match the system's requirements closely. We will look at how NVIDIA measures against the main parts of the CANSLIM method.
Matching the Main CANSLIM Financial Rules
The "C" and "A" in CANSLIM require powerful recent and yearly profit expansion, which are the foundation of the method. NVIDIA's financial results over the last year have been remarkable, clearly passing the system's strict standards.
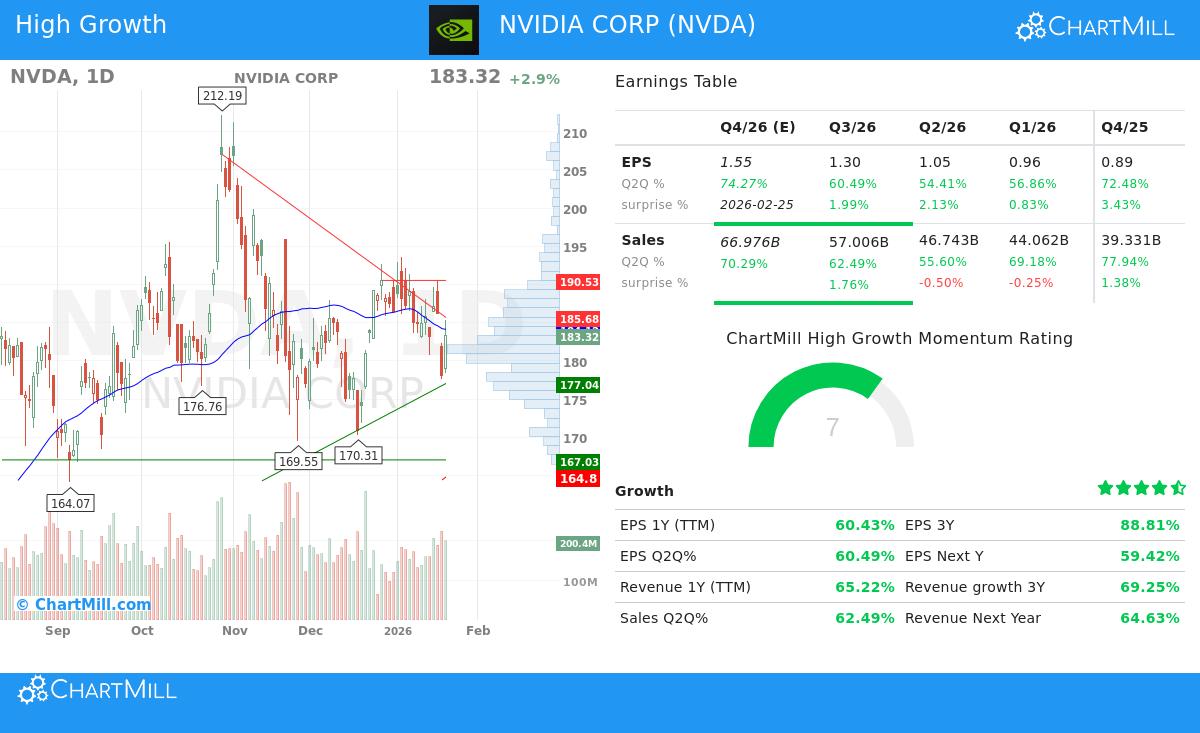
- Recent Quarterly Profits & Sales (C): The system searches for increasing quarterly earnings per share and sales expansion, frequently with at least 20-25%. NVIDIA's latest quarter displays a huge year-over-year EPS expansion of 60.5% and sales expansion of 62.5%, signaling strong, continuing business force.
- Yearly Profit Gains (A): A record of solid yearly expansion is needed to confirm steadiness. NVIDIA's three-year EPS compound annual growth rate (CAGR) is a notable 88.8%, well above the common 25-50% level. Also, its Return on Equity (ROE) of 83.4% shows outstanding earnings power and effective use of investor money, another main financial check.
These numbers, listed in NVIDIA's detailed financial examination report, describe a company operating at full capacity. The "N" in CANSLIM, which means New products, New highs, is also evident in NVIDIA's operations, as its AI-centered data center systems represent a significant new product phase propelling its financial outcomes.
Institutional Support and Price Performance
The "I" and "L" rules concentrate on market approval. CANSLIM states that even the best financials require buying from large investment firms and top-tier price action to support a large price rise.
- Institutional Support (I): The method prefers stocks with rising ownership by funds, but not so much that all possible buyers are already involved. NVIDIA's institutional ownership is 69.2%, which is in a good area, implying there is still capacity for more institutional buying.
- Leader or Laggard (L): This is judged by relative strength (RS), which contrasts a stock's price action with the wider market. CANSLIM investors look for stocks in the highest group. NVIDIA's present relative strength of 75.8 shows it is doing better than about three-fourths of all stocks, making it a market leader. This chart-based leadership is a key sign that the market is valuing its financial strength.
Company Strength and Share Availability
The "S" in CANSLIM deals with Supply and Demand, focusing on good financial condition and reasonable share count.
- NVIDIA does very well here with a very small Debt-to-Equity ratio of 0.06, showing little use of borrowed money and a solid financial position. This strength offers security and options, lowering risk for investors.
- While the filter did not check for available shares, NVIDIA's high typical daily share count ensures very good market fluidity, allowing for simpler trading in and out, an important real factor for traders.
Chart Environment and Market Condition
The last part, "M" for Market Condition, tells investors that even the strongest stocks can have difficulty in a negative total market. At present, the S&P 500 indicates a positive near-term trend, giving a generally helpful setting for leading stocks like NVIDIA.
NVIDIA's own chart analysis report shows a detailed view. While the long-term trend is still positive, the stock has been pausing in recent months after a very large earlier rise. The chart rating is neutral, showing this time of rest near record prices. For CANSLIM investors, such pauses can create the "correctly shaped chart patterns" noted in the "N" rule, possibly preparing for a new price move if the financial story stays strong.
Conclusion and Additional Study
NVIDIA CORP makes a strong argument for investors using the CANSLIM growth method. It shows:
- Huge Financial Expansion: Well beyond standards for recent and yearly profit gains.
- Top-Tier Earnings Power: Shown by exceptional ROE and earnings percentages.
- Market Leadership: Verified by high relative strength and solid institutional attention.
- Strong Financial Condition: With very little debt and high market fluidity.
While its chart view indicates a pause after a record rise, its basic financials match strongly with the CANSLIM idea of buying powerful, expanding companies as the market starts to see their possibility.
Want to find other stocks that match the CANSLIM growth method? You can use the same filter that found NVIDIA and see the present outcomes by going to the O'Neill CANSLIM High Growth filter.
,
Disclaimer: This article is for information only and is not financial guidance, a suggestion, or a proposal to buy or sell any investments. The CANSLIM method includes risk, and previous results do not guarantee future outcomes. Investors should do their own complete study and think about their personal financial position and risk comfort before making any investment choices.