
For investors looking for dependable income, dividend investing stays a key method for creating lasting wealth. One organized method uses filters to find companies that provide appealing dividends and also show basic soundness to keep up those payments. This system favors stocks with good dividend scores while keeping sufficient earnings capacity and monetary condition, making sure picks are not just high-payment traps but businesses with real ability to preserve and raise payouts over time. NETAPP INC (NASDAQ:NTAP) appears as a notable option through this strict filtering process, displaying traits that dividend investors frequently find attractive.
Dividend Reliability and Sustainability
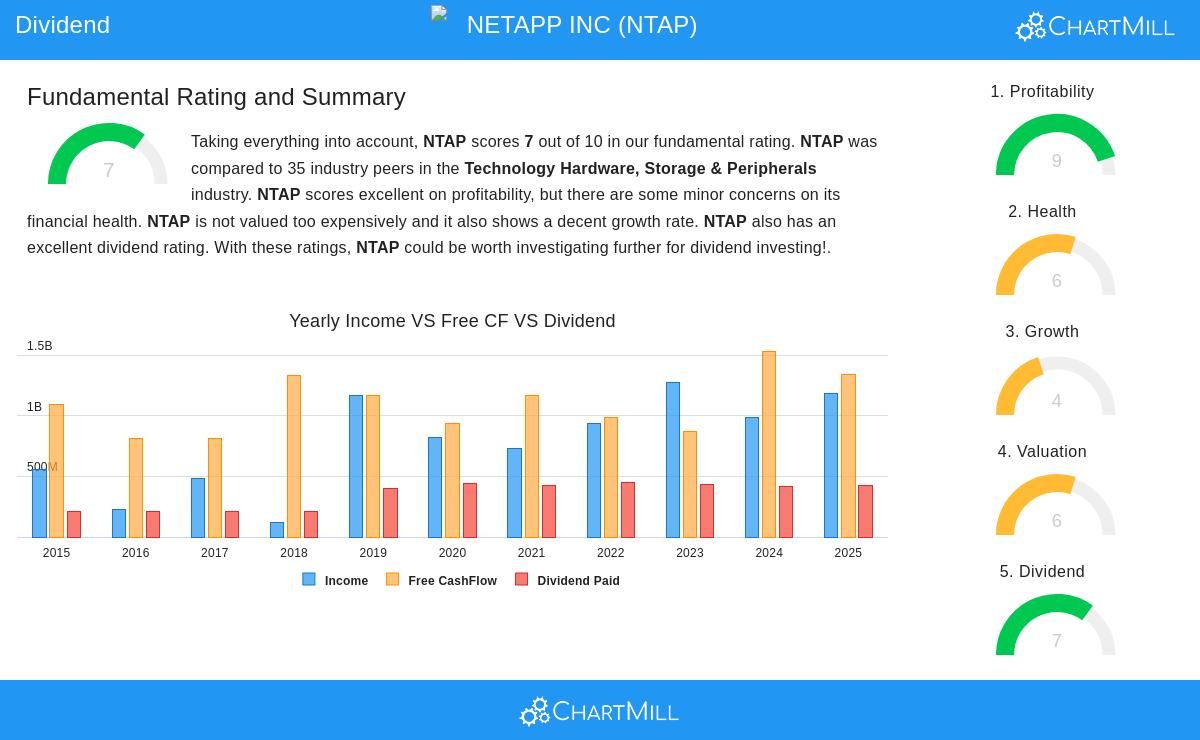
NetApp's dividend profile displays several traits that income-oriented investors usually appreciate. The company keeps a maintainable payment plan backed by steady profits and thoughtful capital management.
Important dividend measures contain:
- Present dividend yield of 1.90%, matching others in its field
- Ten-year history of continuous dividend payments
- No dividend decreases in the last ten years
- Payout ratio of 35.95%, showing good safety room
- Small but steady yearly dividend rise of 1.72%
The fairly low payout ratio is especially important for dividend continuity. With under 36% of profits paid as dividends, NetApp keeps enough money to put back into business activities while continuing dividend payments even in economic slumps. This careful method to dividend payment lowers the chance of future reductions and allows for slow rises over time.
Profitability Supporting Dividend Payments
NetApp's notable profitability creates the base for its consistent dividend payments. The company reaches good returns on capital that easily beat its capital costs, producing real owner value while financing dividend distributions.
Profitability points:
- Return on Equity of 120.10%, doing better than 97% of similar companies
- Return on Invested Capital of 19.25%, above 85% of rivals
- Profit margin of 17.77% placed in the top group of the field
- Operating margin of 21.79% showing operational effectiveness
- Gross margin of 70.00% pointing to good price control
These solid profitability numbers are key for dividend investors because they show the company has lasting competitive benefits and effective operations. High returns on capital imply that NetApp can keep producing enough profits to finance both business reinvestment and owner returns without weakening either goal.
Financial Health Evaluation
While NetApp displays some points to watch, its general monetary condition backs continued dividend reliability. The company keeps sufficient cash availability and workable debt levels compared to its cash creation.
Financial health notes:
- Debt to free cash flow ratio of 1.50, showing good debt handling ability
- Current ratio of 1.31 and quick ratio of 1.28, giving short-term room
- Steady positive cash flow from operations over five years
- Share number decrease through repurchases improving per-share measures
- Altman-Z score of 2.78, though in the middle area, still beats 68% of others
The debt-to-equity ratio of 2.55 seems higher but needs background. Given NetApp's large free cash flow creation, the company can easily handle its debts while keeping dividends. For dividend investors, this balanced use of debt allows financing growth projects while keeping distribution ability.
Valuation and Growth Background
NetApp shows fair valuation levels that give safety space for dividend investors. The company's growth outlook, while average, seems maintainable and fitting to its dividend plan.
Valuation and growth features:
- P/E ratio of 14.71, under field and S&P 500 norms
- Forward P/E of 12.25, meaning a price cut compared to the wider market
- Expected EPS growth of 9.78% each year, supporting dividend growth
- Steady sales growth path near 4% yearly
- Enterprise Value/EBITDA multiple below 77% of field rivals
These valuation numbers suggest investors are not paying too much for NetApp's dividend income or growth possibility. The expected profit growth easily beats the dividend growth rate, showing the present payout ratio might get better still, creating space for future dividend raises.
Full Fundamental Evaluation
NetApp's complete fundamental picture, as described in the full fundamental analysis report, shows a company with good profitability, fair valuation, and reliable dividend traits. While growth stays average and financial health displays some points to watch, the central parts backing dividend continuity seem well-set. The company's strategic place in hybrid cloud systems gives a stable base for continued cash creation to support owner returns.
For investors looking for more dividend choices filtered using similar methods, the Best Dividend Stocks screener gives regularly refreshed picks based on dividend quality, profitability, and financial health rules.
Disclaimer: This analysis uses fundamental data and filtering systems for information only. It is not investment guidance, and investors should do their own study and think about their personal money situation before making investment choices. Past results do not ensure future outcomes, and dividend payments depend on company decisions and market factors.