
For investors looking for dependable income, dividend investing is a fundamental method that mixes present return with lasting stability. The process used here applies ChartMill's organized filtering method, which finds companies displaying solid dividend traits while keeping acceptable financial condition and earnings. This even-handed filtering standard helps prevent the usual mistake of pursuing very high returns that could indicate hidden financial trouble. By setting basic scores across several essential areas, this method finds companies able to maintain and possibly raise their dividend distributions going forward.
NETAPP INC (NASDAQ:NTAP) appears as a notable option from this filtering process, especially for investors focusing on dividend dependability in the technology hardware field. The company's concentration on hybrid and public cloud data management services puts it in an increasing market area, while its long operating history offers the steadiness dividend investors usually want.
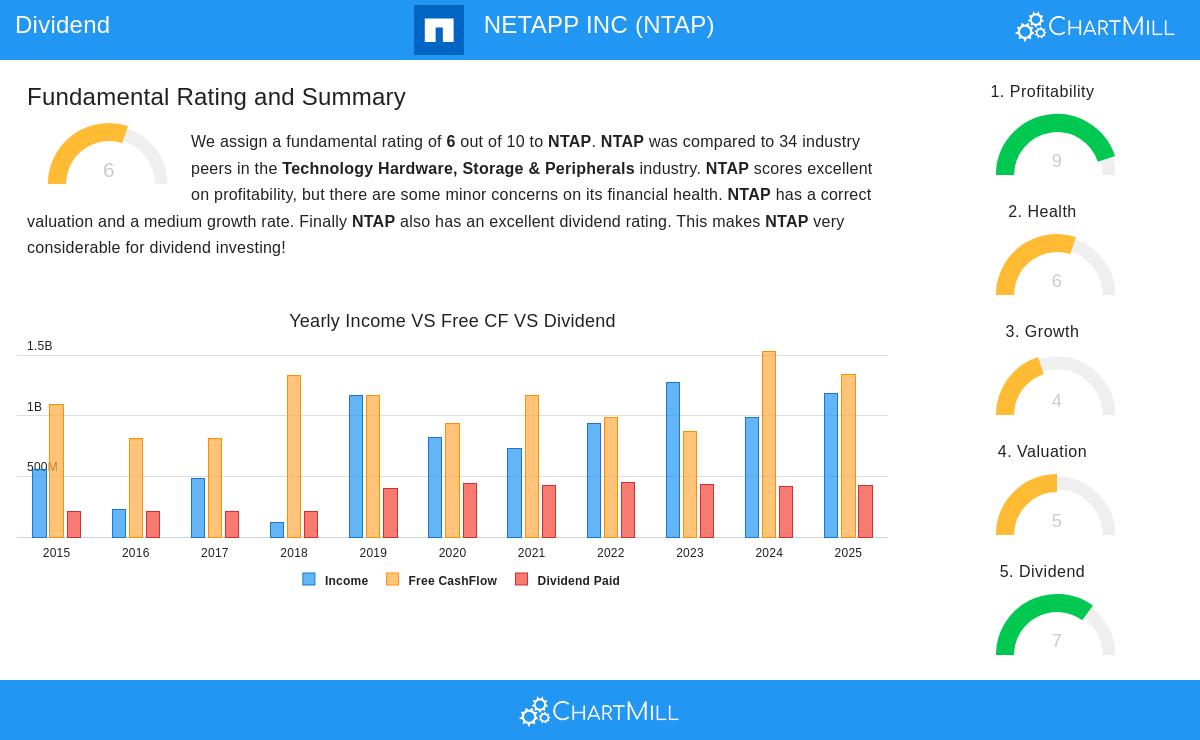
Dividend Dependability and Lasting Quality
NetApp's dividend outline shows several traits that match with sound dividend investing rules. The company keeps a maintainable distribution plan that mixes shareholder payouts with business requirements.
- Satisfactory Return with Better Industry Results: NetApp's present dividend return of 1.74% is higher than the average for similar companies in its field, putting it in the leading group of technology hardware firms. While not large compared to some high-return areas, this is a good return within its industry.
- Established History: The company has continued regular dividend distributions for more than ten years without cuts, building a dependable payment record that dividend investors appreciate.
- Maintainable Distribution Level: With just 35.95% of earnings paid as dividends, NetApp keeps significant earnings for reinvestment and business adaptability. This careful distribution level offers protection against possible earnings changes.
- Earnings-Dividend Match: The company's earnings increase has regularly been faster than dividend rises, confirming the lasting quality of present payment amounts without stressing financial means.
Profitability Supporting Dividend Distributions
NetApp's very good profitability measures, shown in its ChartMill Profitability Rating of 9, supply the basic support needed for dependable dividend payments. The company shows effectiveness in turning operations into shareholder value through several ways.
- Better Profitability Measures: Return on invested capital of 19.25% is much higher than the company's capital cost, showing effective use of resources. Return on equity is a notable 120.10%, while return on assets of 12.10% is with the field leaders.
- Solid Margin Picture: Operating margins of 21.79% and profit margins of 17.77% both put NetApp in the leading group of its industry, giving full coverage for dividend responsibilities. The company's gross margin of 70% represents top-level results within its field.
- Margin Improvement Pattern: Both operating and profit margins have displayed gains in recent years, pointing to continuous operational effectiveness improvements that are positive for future dividend lasting quality.
Financial Condition Evaluation
With a ChartMill Health Rating of 6, NetApp shows acceptable financial steadiness with some parts needing watching. The company's balance sheet shows a varied picture that dividend investors should think about in their full assessment.
- Debt Handling: While the debt-to-equity ratio seems raised at 2.55, this measure is lessened by solid free cash flow production. The debt-to-free-cash-flow ratio of 1.50 shows the company could in theory pay off all debt in under two years using present cash flow levels.
- Cash Availability: Current and quick ratios of 1.31 and 1.28 respectively indicate enough short-term cash to meet responsibilities, although these measures are below some industry counterparts.
- Capital Return Plan: The decrease in shares available over both one-year and five-year spans points to a continuing share buyback program, adding to the dividend as part of total shareholder payouts.
Value and Increase Background
NetApp offers a fairly priced investment chance when viewed next to its dividend traits and basic strength.
- Good Value Measures: Trading at a P/E ratio of 16.22 and forward P/E of 13.49, NetApp seems low-priced relative to both industry counterparts and the wider S&P 500 index.
- Moderate Increase Picture: Revenue increase has been steady though moderate, while earnings per share have shown stronger historical increase. Analyst forecasts indicate continued earnings increase in the high single digits, supporting future dividend rises.
- Cash Flow Production: Solid free cash flow generation supplies the basic support for both dividend payments and the continuing share buyback program.
For investors wanting to research similar dividend chances, the Best Dividend Stocks screen gives more options meeting these even-handed standards for dividend lasting quality, profitability, and financial condition.
A more complete basic study of NetApp is available through the detailed ChartMill fundamental report, which gives deeper understanding of the company's financial position and dividend lasting quality measures.
Disclaimer: This study is based on present basic data and filtering processes and does not make up investment guidance. Investors should do their own research and think about their personal financial situation before making investment choices. Past results do not assure future outcomes, and dividend payments are subject to company decision and financial ability.