
Unearth the potential of NETAPP INC (NASDAQ:NTAP) as a dividend stock recommended by our stock screening tool. NASDAQ:NTAP maintains a robust financial footing and delivers a sustainable dividend. We'll delve into the details below.
Understanding NASDAQ:NTAP's Dividend Score
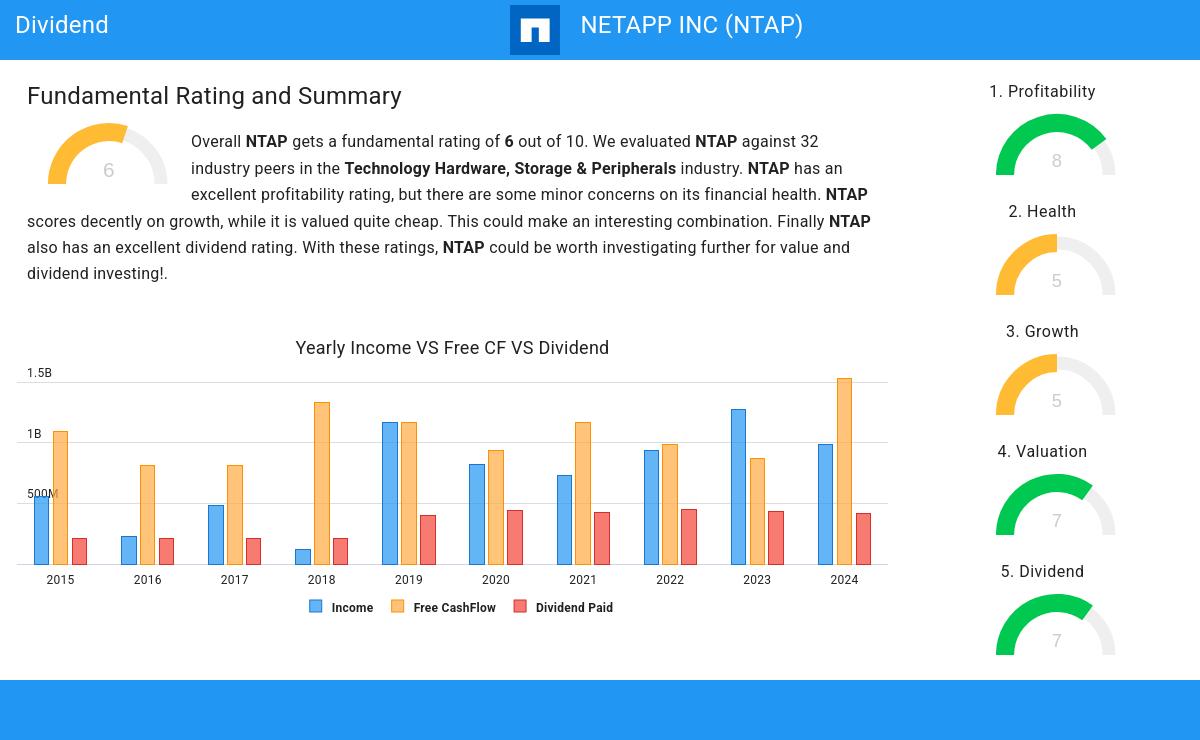
ChartMill provides a Dividend Rating for every stock, ranging from 0 to 10. This rating assesses various dividend aspects, including yield, growth, and sustainability. NASDAQ:NTAP earns a 7 out of 10:
- NTAP's Dividend Yield is a higher than the industry average which is at 2.95.
- NTAP has paid a dividend for at least 10 years, which is a reliable track record.
- NTAP has not decreased their dividend for at least 10 years, which is a reliable track record.
- NTAP pays out 37.20% of its income as dividend. This is a sustainable payout ratio.
- The dividend of NTAP is growing, but earnings are growing more, so the dividend growth is sustainable.
Evaluating Health: NASDAQ:NTAP
ChartMill employs a unique Health Rating system for all stocks. This rating, ranging from 0 to 10, is determined by analyzing various liquidity and solvency ratios. For NASDAQ:NTAP, the assigned 5 for health provides valuable insights:
- With a decent Altman-Z score value of 2.60, NTAP is doing good in the industry, outperforming 68.75% of the companies in the same industry.
- The Debt to FCF ratio of NTAP is 1.58, which is an excellent value as it means it would take NTAP, only 1.58 years of fcf income to pay off all of its debts.
- The Debt to FCF ratio of NTAP (1.58) is better than 84.38% of its industry peers.
- Although NTAP does not score too well on debt/equity it has very limited outstanding debt, which is well covered by the FCF. We will not put too much weight on the debt/equity number as it may be because of low equity, which could be a consequence of a share buyback program for instance. This needs to be investigated.
Evaluating Profitability: NASDAQ:NTAP
ChartMill assigns a proprietary Profitability Rating to each stock. The score is computed by evaluating various profitability ratios and margins and ranges from 0 to 10. NASDAQ:NTAP was assigned a score of 8 for profitability:
- Looking at the Return On Assets, with a value of 12.65%, NTAP belongs to the top of the industry, outperforming 87.50% of the companies in the same industry.
- NTAP's Return On Equity of 114.27% is amongst the best of the industry. NTAP outperforms 96.88% of its industry peers.
- NTAP's Return On Invested Capital of 22.77% is amongst the best of the industry. NTAP outperforms 84.38% of its industry peers.
- The 3 year average ROIC (15.62%) for NTAP is below the current ROIC(22.77%), indicating increased profibility in the last year.
- NTAP has a better Profit Margin (17.47%) than 96.88% of its industry peers.
- NTAP's Operating Margin of 21.48% is amongst the best of the industry. NTAP outperforms 93.75% of its industry peers.
- With an excellent Gross Margin value of 70.62%, NTAP belongs to the best of the industry, outperforming 96.88% of the companies in the same industry.
- In the last couple of years the Gross Margin of NTAP has grown nicely.
Every day, new Best Dividend stocks can be found on ChartMill in our Best Dividend screener.
Our latest full fundamental report of NTAP contains the most current fundamental analsysis.
Keep in mind
This is not investing advice! The article highlights some of the observations at the time of writing, but you should always make your own analysis and invest based on your own insights.