
SERVICENOW INC (NYSE:NOW) was identified as a Technical Breakout Setup Pattern by our stockscreener. Such a pattern occurs when we see a pause in a strong uptrend: after a strong rise the stock is consolidating a bit and at some point the trend may be continued. Whether this actually happens can not be predicted of course, but it may be a good idea to keep and eye on NYSE:NOW.
Insights from Technical Analysis
Every day ChartMill assigns a Technical Rating to every stock. The score ranges from 0 to 10 and is determined by evaluating multiple technical indicators and properties.
We assign a technical rating of 10 out of 10 to NOW. This is due to a consistent performance in both the short and longer term time frames. Also compared to the overall market, NOW is showing a nice and steady performance.
- Both the short term and long term trends are positive. This is a very positive sign.
- Looking at the yearly performance, NOW did better than 91% of all other stocks. We also observe that the gains produced by NOW over the past year are nicely spread over this period.
- NOW is part of the Software industry. There are 278 other stocks in this industry. NOW outperforms 75% of them.
- NOW is currently trading near its 52 week high, which is a good sign. The S&P500 Index however is also trading near new highs, which makes the performance in line with the market.
- In the last month NOW has a been trading in the 993.42 - 1157.90 range, which is quite wide. It is currently trading near the high of this range.
Our latest full technical report of NOW contains the most current technical analsysis.
How does the Setup look for NYSE:NOW
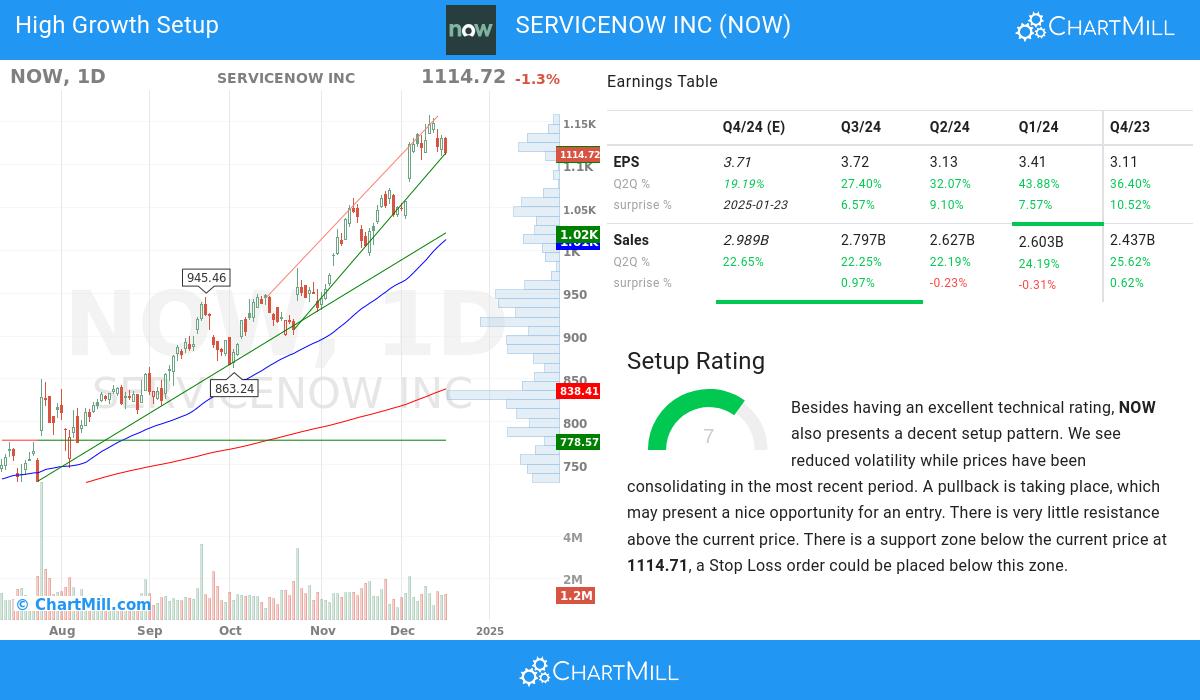
ChartMill also assign a Setup Rating to every stock. With this score it is determined to what extend the stock has been trading in a range in the recent days and weeks. This score also ranges from 0 to 10 and is updated daily. The setup score evaluates various short term technical indicators. NYSE:NOW scores a 7 out of 10:
NOW has an excellent technical rating and also presents a decent setup pattern. Prices have been consolidating lately and the volatility has been reduced. A pullback is taking place, which may present a nice opportunity for an entry. There is very little resistance above the current price. There is a support zone below the current price at 1114.71, a Stop Loss order could be placed below this zone.
Some of the high growth metrics of NYSE:NOW highlighted
- The recent financial report of SERVICENOW INC demonstrates a 27.4% increase in quarterly earnings compared to the previous quarter. This growth indicates positive momentum in the company's financials and suggests a promising upward trend
- SERVICENOW INC has experienced 22.25% q2q revenue growth, indicating a significant sales increase.
- SERVICENOW INC has experienced 32.21% growth in EPS over a 3-year period, demonstrating its ability to generate sustained and positive earnings momentum.
- The 1-year revenue growth of SERVICENOW INC (23.48%) has been strong, reflecting the company's ability to generate consistent sales growth. This growth suggests the company's ability to meet customer needs and expand its market share.
- The recent financial report of SERVICENOW INC demonstrates a 27.4% increase in quarterly earnings compared to the previous quarter. This growth indicates positive momentum in the company's financials and suggests a promising upward trend
- SERVICENOW INC has shown positive growth in its operating margin over the past year, indicating improved operational efficiency. This growth highlights the company's ability to effectively manage costs and maximize profitability.
- SERVICENOW INC has shown positive growth in its free cash flow (FCF) over the past year, indicating improved cash generation and financial strength. This growth highlights the company's ability to effectively manage its cash flows and generate surplus funds.
- With a favorable Return on Equity (ROE) of 14.38%, SERVICENOW INC demonstrates its ability to deliver attractive returns for shareholders. This metric highlights the company's effective management of assets and its profitability.
- SERVICENOW INC maintains a healthy Debt-to-Equity ratio of 0.16. This indicates the company's conservative capital structure and signifies its ability to effectively manage debt obligations while maintaining a strong equity position.
- SERVICENOW INC has consistently surpassed EPS estimates in the last 4 quarters, reflecting its strong financial performance and effective management. This trend suggests the company's ability to generate positive earnings surprises and drive shareholder value.
- SERVICENOW INC has achieved an impressive Relative Strength (RS) rating of 91.03, showcasing its ability to outperform the broader market. This strong performance positions SERVICENOW INC as an attractive stock for potential price appreciation.
More high growth momentum breakout stocks can be found in our High Growth Momentum Breakout screen.
Disclaimer
This article should in no way be interpreted as advice. The article is based on the observed metrics at the time of writing, but you should always make your own analysis and trade or invest at your own responsibility.


