
Sometimes you open a scan result and you immediately feel the market tone.
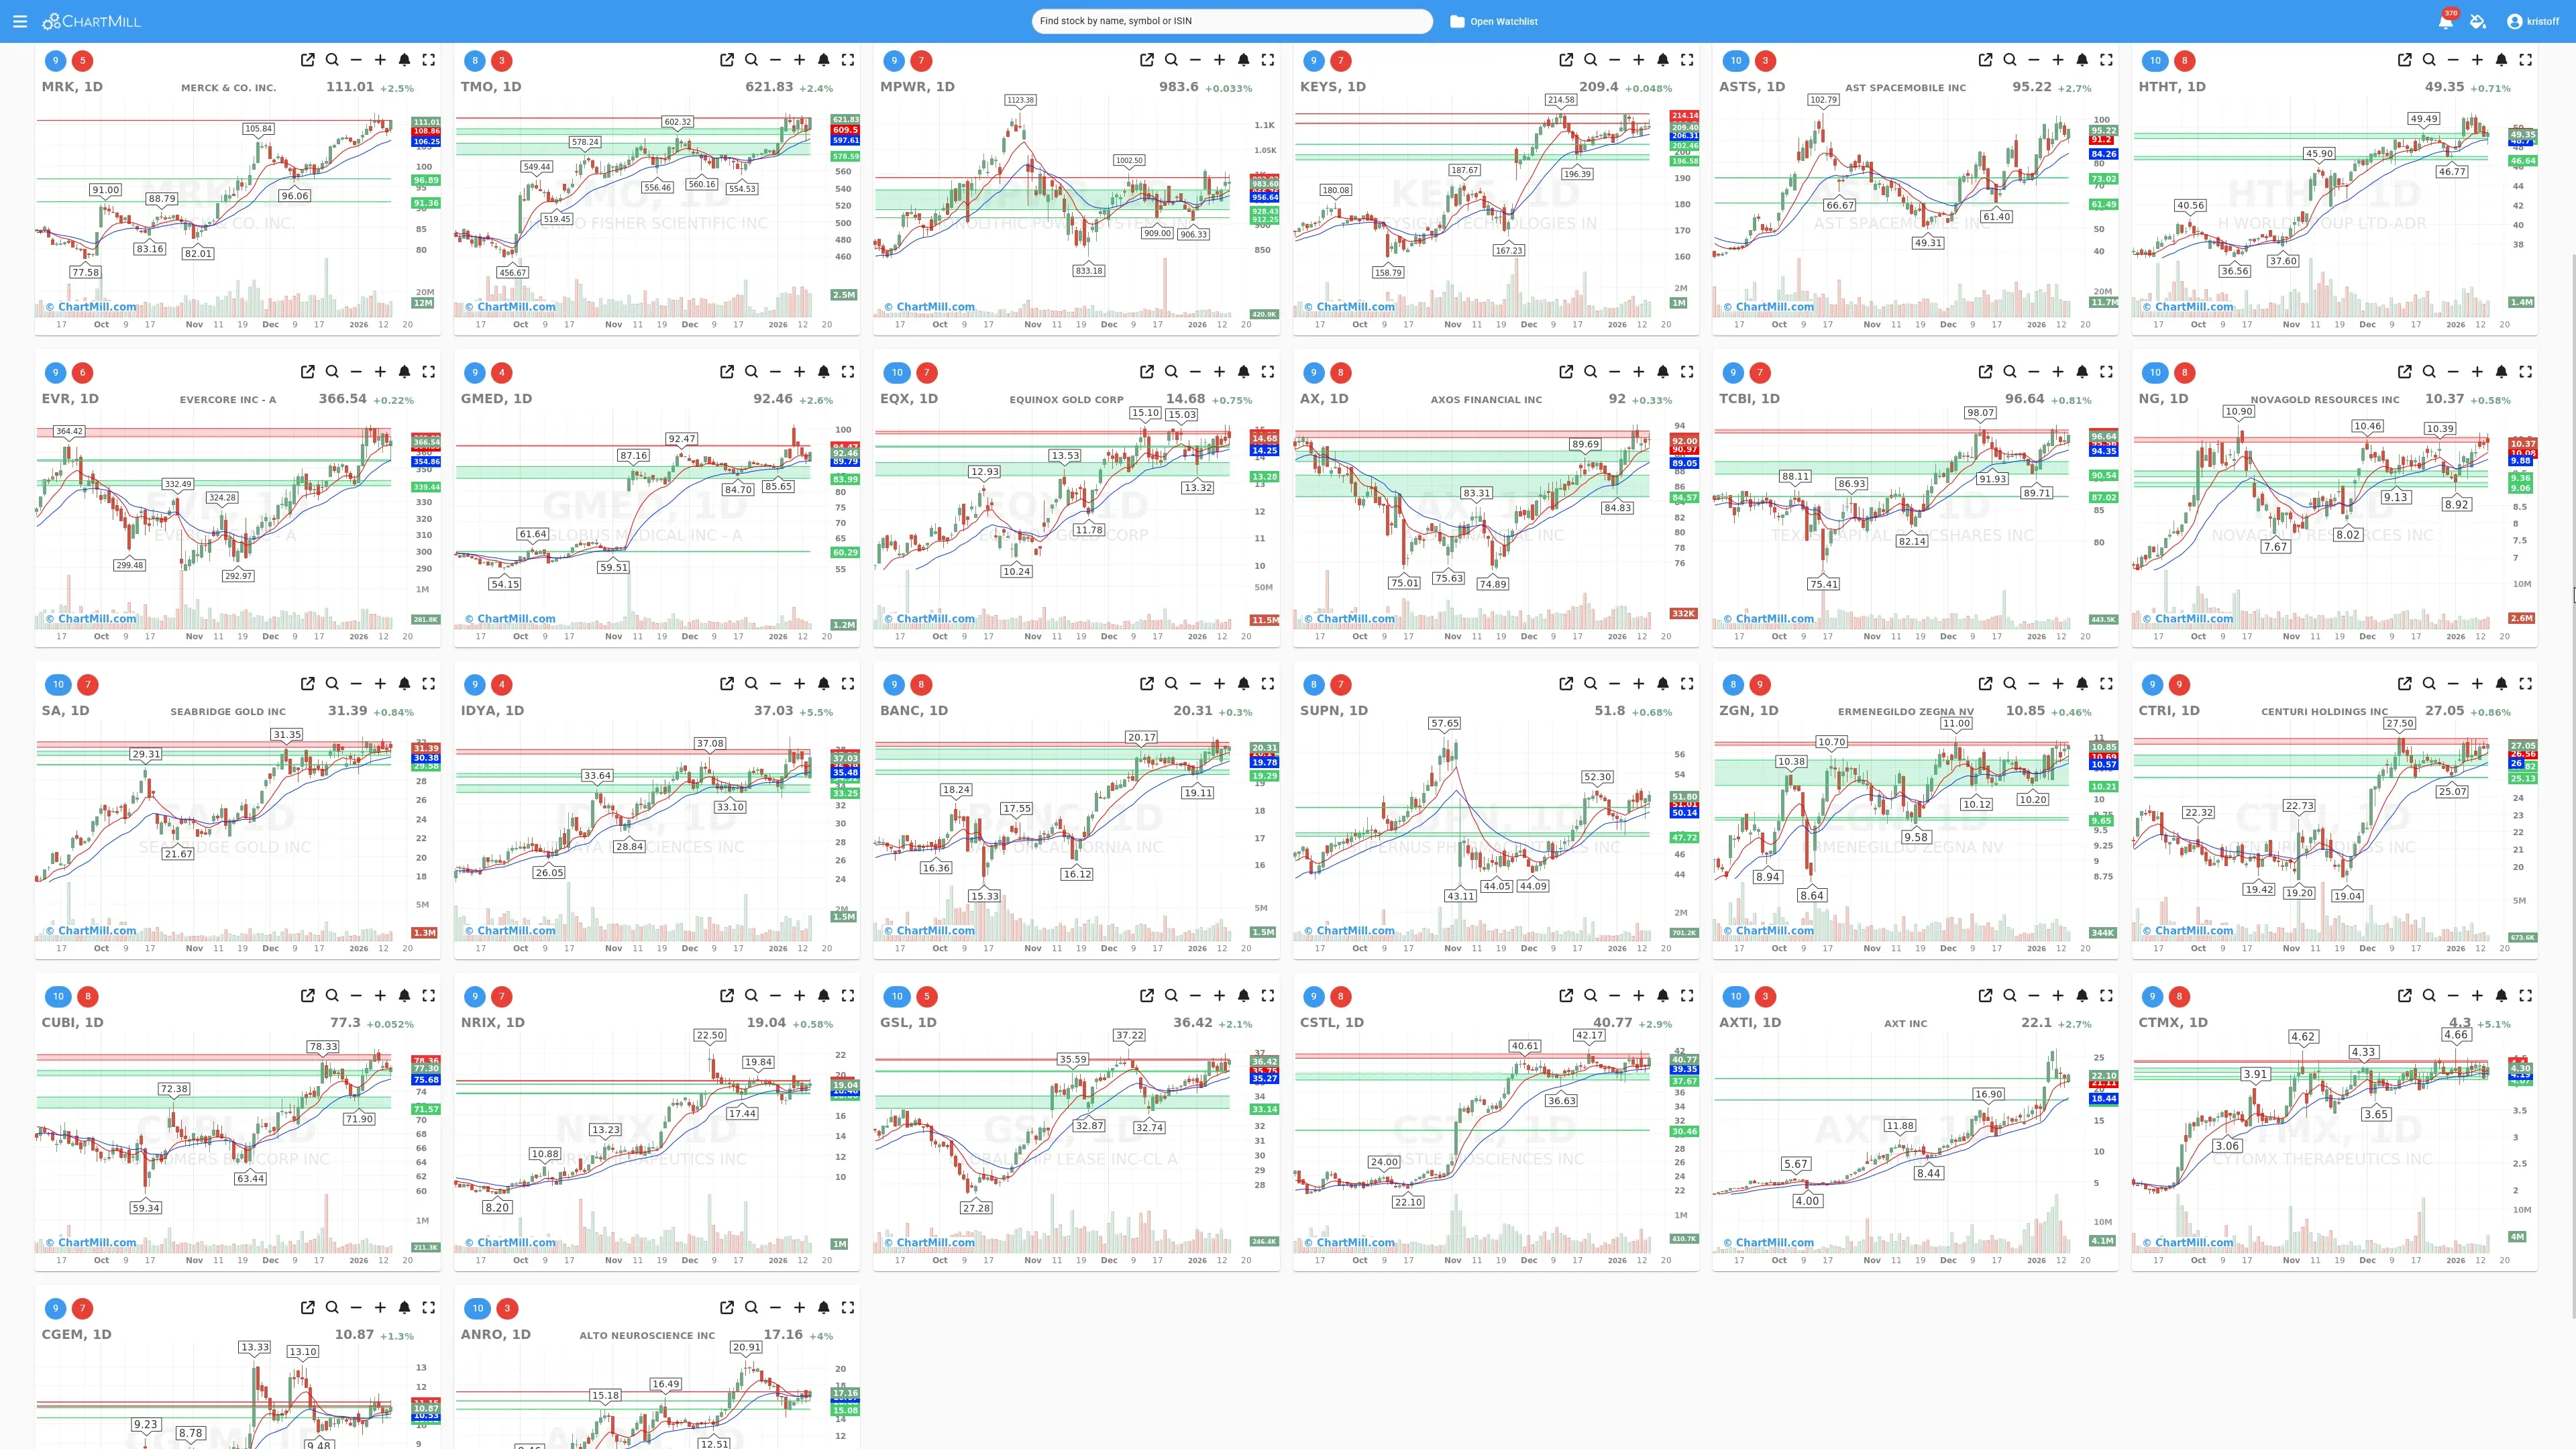
That’s exactly what happened here: the screenshot above is a daily watchlist, packed with US stocks that are already in established uptrends, and now look like they’re resting in tight ranges near the EMA9 / EMA21.
These are the tickers for all 26 stocks from the image above:
MRK, TMO, MPWR, KEYS, ASTS, HTHT, EVR, GMED, EQX, AX, TCBI, NG, SA, IDYA, BANC, SUPN, ZGN, CTRI, CUBI, NRIX, GSL, CSTL, AXTI, CTMX, CGEM, ANRO
For subscribers: have a look at these charts in ChartMill, click here ( be sure that you are logged in)
(The total list contained approximately 300 stocks (out of our database of more than 26,000 tickers!) which I then checked manually for the final daily watchlist). This is a direct link to the exact screen I used.
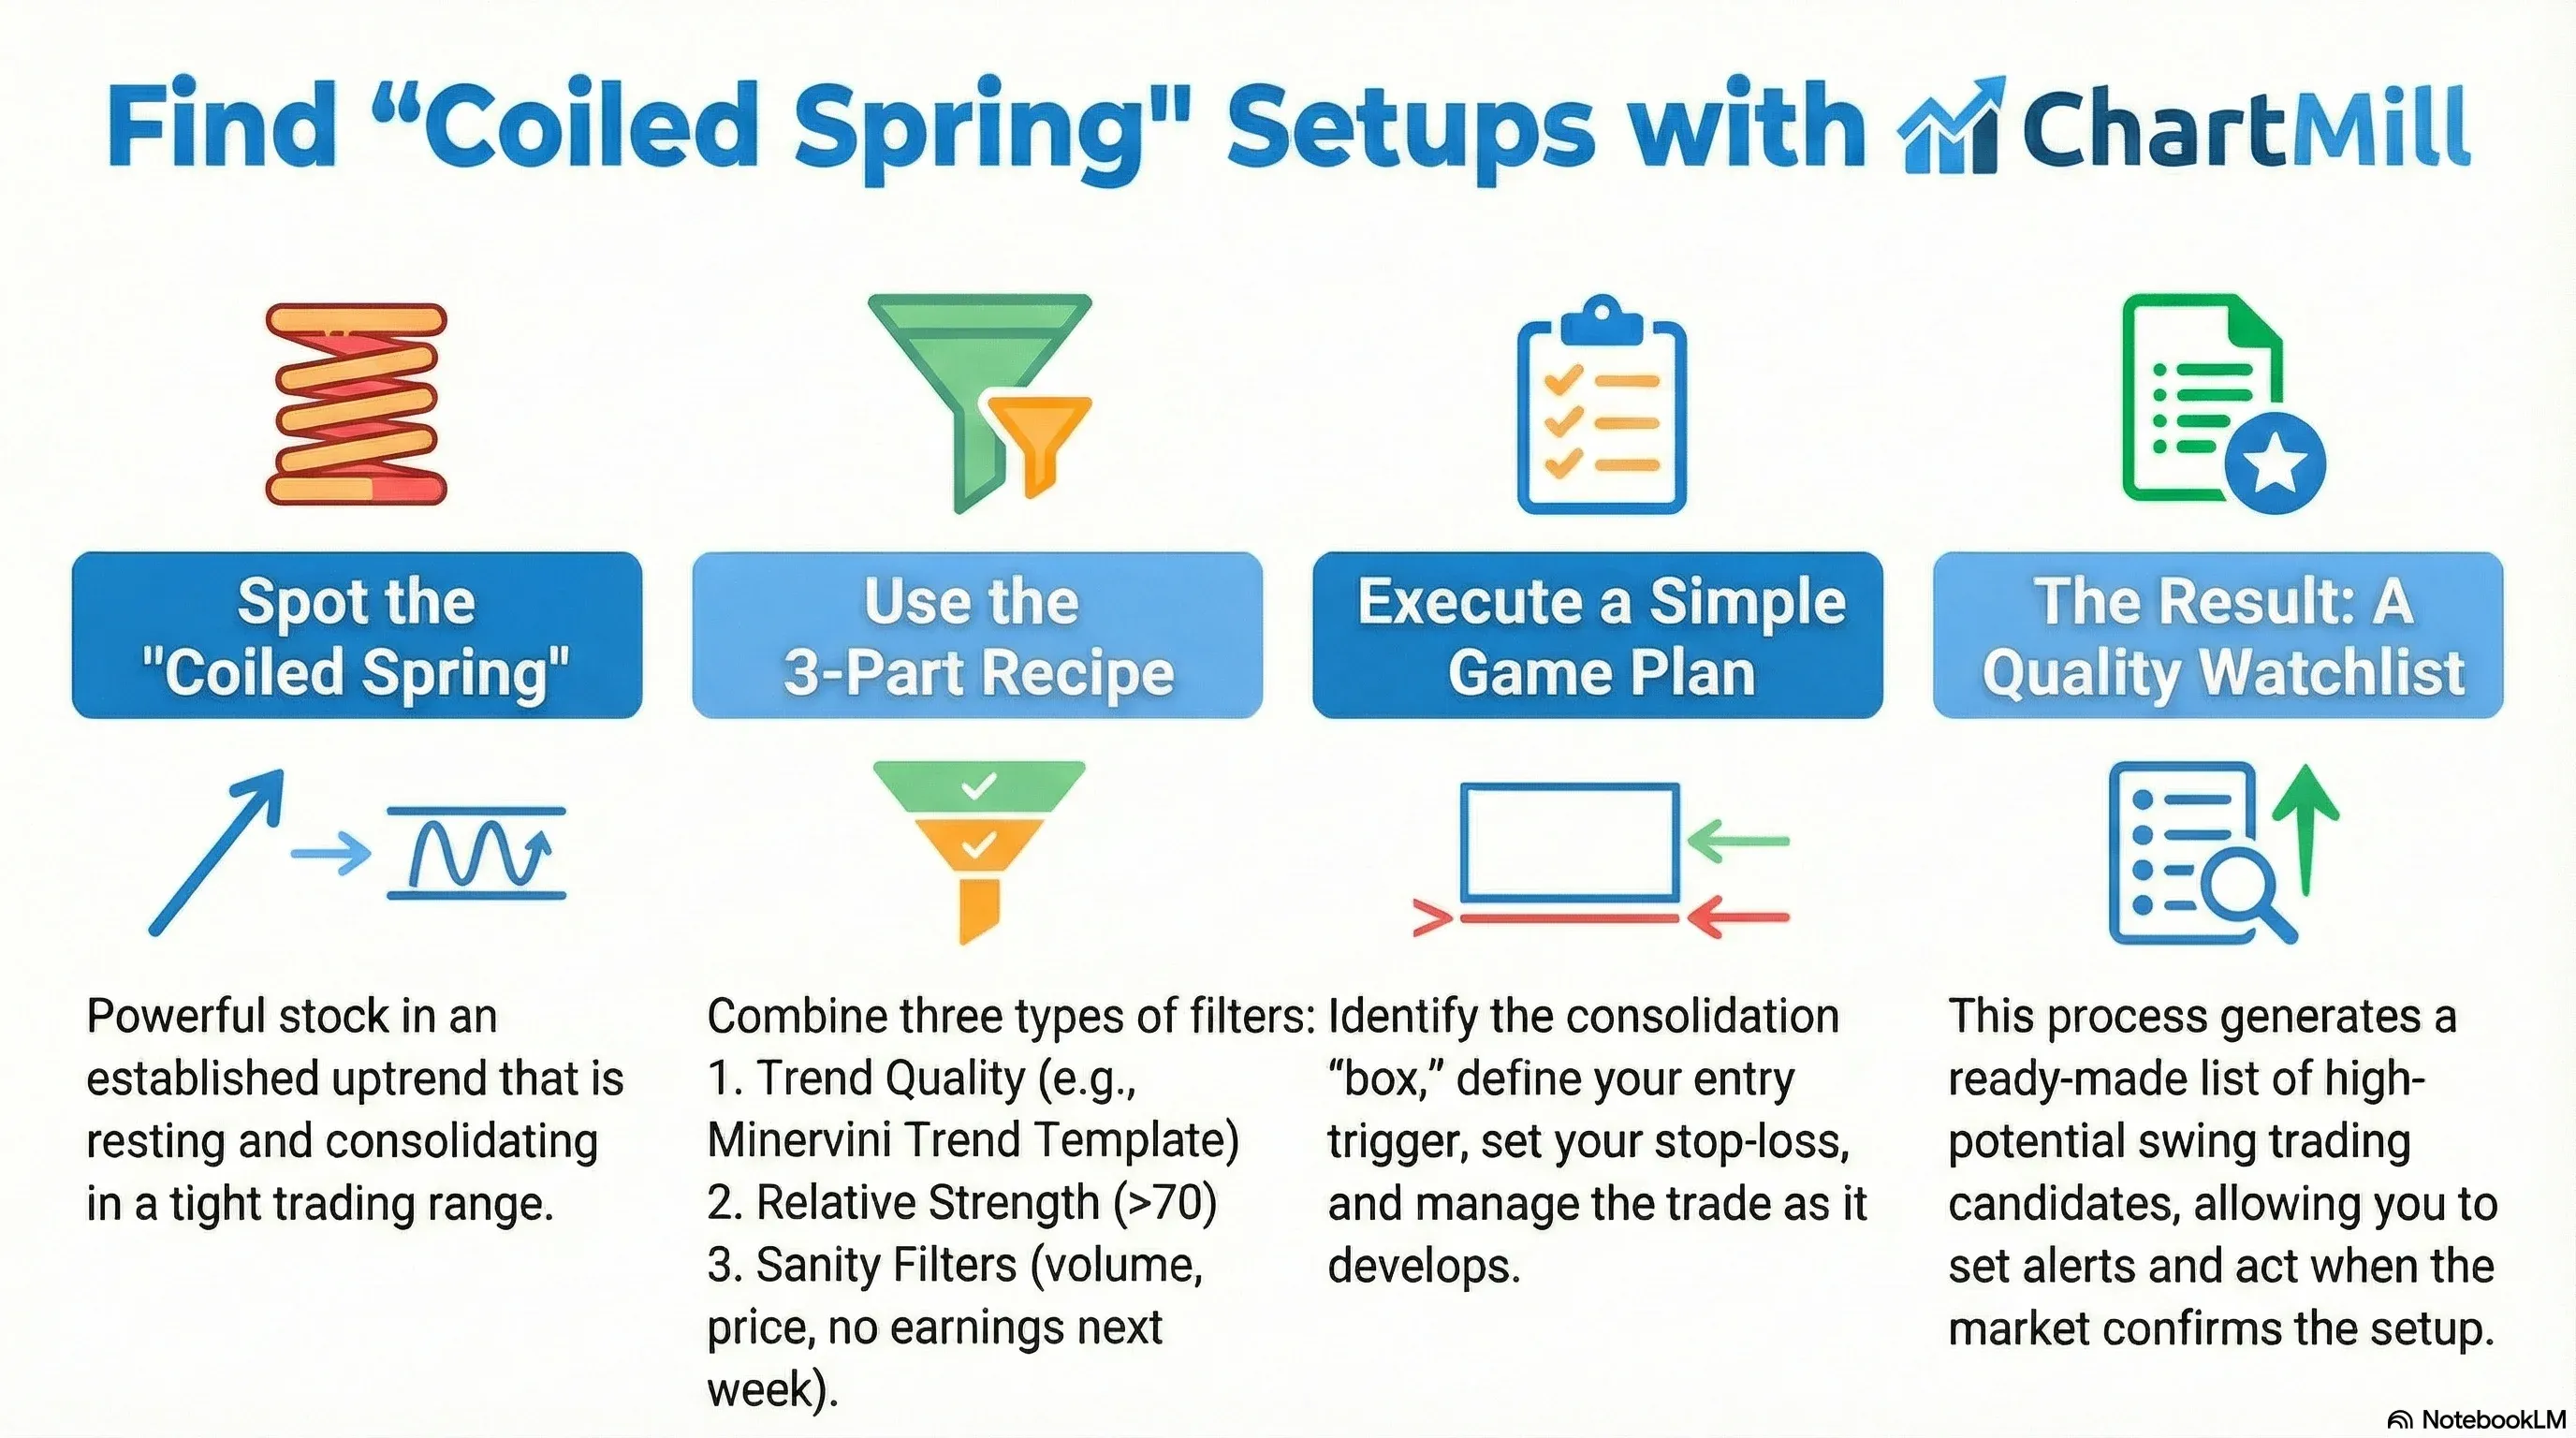
That’s the classic “coiled spring” look: strong trend + controlled digestion + potential next leg.
I’m not going to break down every chart in the grid (that would be a book), but I do want to highlight the key takeaway:
This is what happens when you combine trend quality + relative strength + sensible tradability filters in a proper stock screener. You end up with a ready-made watchlist of swing candidates.
And yes, this list was generated with ChartMill.
One extra note: a noticeable chunk of this watchlist sits in Healthcare (especially biotech/pharma) and that matters. These names can be more volatile and headline-driven than the average stock because a single catalyst (trial data, FDA updates, guidance changes, lawsuit news, M&A rumors) can move price hard in either direction, sometimes even without warning.
So treat them with a bit more respect: position size accordingly, define risk clearly, and always do your own due diligence.
If that style doesn’t fit your risk profile, the fix is simple: exclude the Biotechnology/Pharmaceuticals industry (or the entire Healthcare sector) in the screener and you’ll still end up with a high-quality trend-and-strength watchlist.
Why this kind of screen works so well for swing traders
When a stock is trending up and then starts moving sideways in a narrow range - especially while staying above key moving averages - it often signals institutional support and lack of aggressive selling.
You’ll typically see:
-
Higher highs / higher lows (trend intact)
-
Pullbacks that stop at EMA9/EMA21 (buyers defend dips)
-
Tight closes / narrow candles (volatility contraction)
-
Clean levels overhead (easy breakout trigger)
That’s exactly the “setups cluster” you want as a swing trader: you’re not hunting one perfect chart… you’re building a bench of A- and B+ candidates and letting price action pick the winners.
The exact filters used (the “trend + strength + sanity” recipe)
Here’s the screen that produced the watchlist:
-
Mark Minervini Trend Template
-
Trend Intensity > 100
-
ChartMill Relative Strength > 70
-
No earnings next week
-
US common stocks only & options available
-
Price ≥ $3
-
%Change > 0%
-
Average volume ≥ 300k
-
Market cap ≥ Small (≈ $300M+)
-
ADR(20)% > 2
This combination is powerful because it does three things at once:
-
Trend Template ensures you’re swimming with the current (not fighting downtrends).
-
Relative Strength > 70 pushes your list toward names that are outperforming.
-
The remaining filters remove “junk setups” (illiquid, untradable, earnings landmines, too sleepy).
-
The result: tradable, moving stocks that are already acting well.
What I’m seeing in the grid: tight ranges near fast support
A lot of charts in your screenshot share the same “behavioral signature”:
-
Price extended earlier → then tightened up
-
Pullback depth contained → often respecting EMA21
-
Several names are now nudging the top of the range
-
Volatility has compressed enough that the next expansion could be meaningful
This is a very swing-trader-friendly environment because your trade plan becomes clean:
-
Trigger: break above the range / pivot high
-
Risk: define a stop beneath the most recent tight low (or below EMA21 if that’s the structure)
-
Reward: ride the next trend leg until momentum fades or the stock loses key support
A simple breakout game plan for this watchlist
Here’s a practical checklist you can apply to any of these charts:
Identify the “box”
Draw the tight range:
-
top = recent highs (resistance)
-
bottom = recent support (often near EMA9/EMA21)
Define the trigger
Common triggers:
-
Break above range high
-
Break above a pivot with expanding volume
-
(Optional) Break + reclaim after a small shakeout
Define the invalidation
Good stop locations:
-
Below the last tight swing low
-
Below EMA21 if it’s clearly acting as support
-
Below the base low (wider stop, fewer shares)
Manage the trade
-
First objective: “does it go?” (quick follow-through is a great sign)
-
Trail stops under higher lows / EMA21 as the trend develops
-
Consider partial profits into strong extensions if your style fits
Why “no earnings next week” is such an underrated filter
Earnings can be great catalysts, but not when you’re trying to execute a clean technical setup.
By filtering out stocks with earnings next week, you reduce:
-
gap risk
-
random volatility spikes
-
stop-outs that have nothing to do with your setup quality
It keeps your watchlist focused on price/volume behavior, not binary events.
How to use this (without overtrading)
When a scan returns this many good-looking charts, the temptation is to jump in everywhere.
A better approach - Pick 5–10 best charts based on:
-
cleanest base
-
strongest relative strength
-
best liquidity
-
clearest breakout level
-
Place alerts at the trigger levels
-
Let the market choose which ones activate
You don’t need to predict. You just need to be prepared.
Final note
This is the exact kind of scan output that makes swing trading feel “systematic” instead of random: you define trend quality, enforce strength, remove landmines, and end up with a repeatable watchlist generator.
If you’re a ChartMill user: save this screen, run it regularly, and build your week around the best-looking bases.
If you’re not: this is a good example of why a solid screener can be a massive edge, not by telling you what to buy, but by consistently putting the right charts in front of you.
(As always, not financial advice, just a structured way to find and manage potential swing setups.)
Kristoff - ChartMill