
The Decent Value investment approach focuses on identifying companies that trade at attractive valuations while maintaining solid fundamental health. This strategy seeks stocks with valuation ratings above 7, indicating they are priced below their intrinsic worth, while also demonstrating adequate profitability, financial stability, and growth potential. The methodology aims to find opportunities where market pricing does not fully reflect a company's underlying financial strength and operational quality.
Valuation Assessment
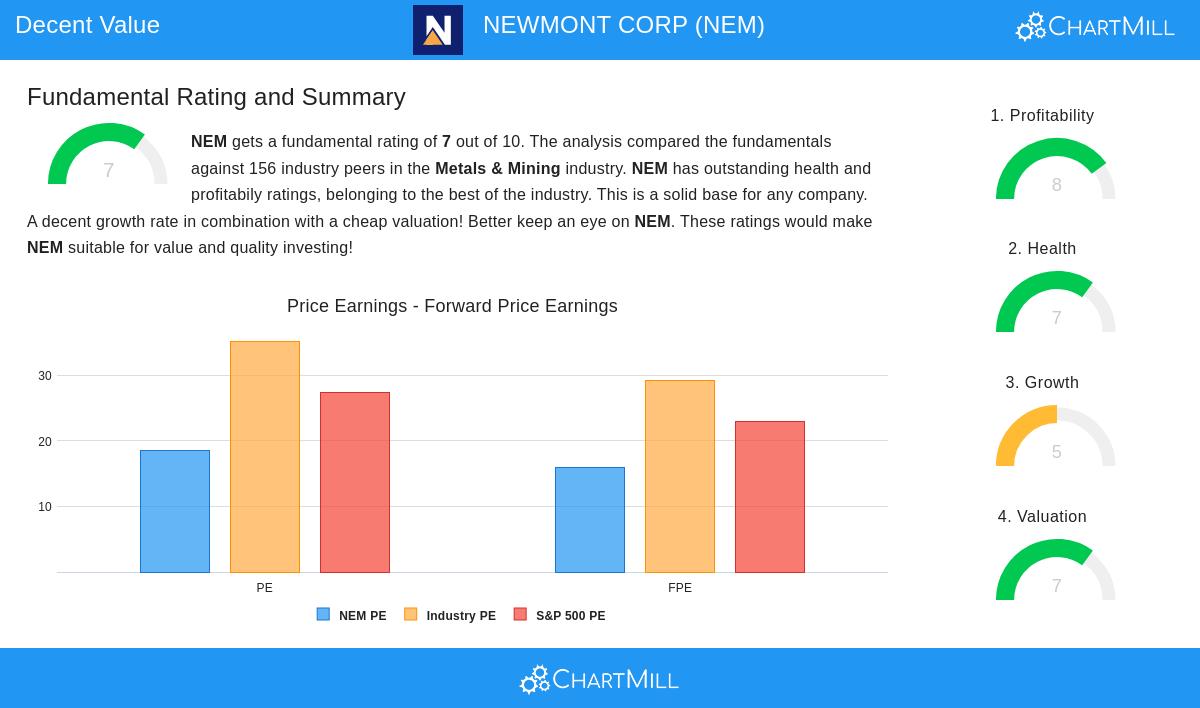
Newmont Corp (NYSE:NEM) presents a strong valuation case, scoring 7 out of 10 in this category. The company's valuation metrics suggest it may be trading below its intrinsic value, a key consideration for value investors seeking a margin of safety.
- Enterprise Value to EBITDA ratio places NEM cheaper than 77.56% of industry peers
- Price to Free Cash Flow ratio ranks better than 86.54% of mining competitors
- Forward P/E ratio of 15.92 compares favorably to industry average of 29.17
- PEG ratio indicates compensation for growth remains attractive
The valuation metrics align with value investing principles by suggesting the market may be undervaluing Newmont's assets and cash flow generation capacity relative to industry standards.
Financial Health and Stability
With a health rating of 7, Newmont demonstrates solid financial foundations crucial for value investors seeking durable businesses. The company's balance sheet strength provides confidence in its ability to withstand economic cycles.
- Debt to Equity ratio of 0.23 indicates conservative leverage
- Current Ratio of 2.23 shows strong short-term liquidity position
- Altman-Z score of 3.82 signals low bankruptcy risk
- Debt to Free Cash Flow ratio of 1.36 suggests rapid debt repayment capacity
These health metrics are particularly important for value investors, as financially sound companies are better positioned to handle market volatility and deliver long-term returns.
Profitability Strength
Newmont's profitability rating of 8 highlights its operational efficiency and competitive advantages within the mining sector. Strong profitability metrics validate the company's business model and management execution.
- Return on Equity of 19.55% outperforms 92.95% of industry peers
- Operating Margin of 38.86% exceeds 91.03% of competitors
- Profit Margin of 30.49% ranks among industry leaders
- Gross Margin of 57.21% demonstrates pricing power and cost control
For value investors, sustained profitability indicates a company's ability to generate returns above its cost of capital, creating shareholder value over time.
Growth Trajectory
While growth receives a moderate rating of 5, Newmont shows impressive historical performance with some near-term headwinds. The company's growth profile offers a balanced perspective for value-oriented investors.
- Earnings Per Share grew 129.58% over the past year
- Revenue increased 38.38% in the most recent period
- 5-year average EPS growth of 21.58% demonstrates historical strength
- Future revenue projections show modest contraction expectations
Value investors typically prioritize current valuation over aggressive growth assumptions, making Newmont's combination of reasonable growth and attractive pricing particularly appealing.
Investment Considerations
The detailed fundamental analysis report reveals Newmont as a company trading at reasonable valuations while maintaining strong profitability and financial health. The mining company's global operations and established production base provide a foundation for consistent performance, though investors should monitor commodity price exposure and execution on future growth initiatives.
For investors seeking additional opportunities following similar criteria, the Decent Value Stocks screen provides regularly updated selections of companies meeting these fundamental standards.
Disclaimer: This analysis is for informational purposes only and does not constitute investment advice, recommendation, or endorsement of any security. Investors should conduct their own research and consult with financial advisors before making investment decisions. Past performance does not guarantee future results.