
In equity investing, methods that join detailed technical study with basic growth measures give a clear way to find possible leading stocks. A method of this kind is the Mark Minervini plan, which uses a defined Trend Template to find stocks in strong, confirmed upward movements. This technical base is joined with a review of a company's basic momentum, looking for those showing quickening profit and revenue increases, a sign of possible high growth. This two-step method tries to find securities that are both technically solid and basically set for more growth.
Newmont Corp (NYSE:NEM) appears as a stock that deserves more study using this view. The top gold mining company globally has shown a notable technical recovery and has basic traits that match a high-growth momentum outline.
Reviewing the Minervini Trend Template
Mark Minervini's Trend Template is made to sort for stocks in a clear Stage 2 rise, marked by firm price trends and better relative performance. The rules make sure an investor buys into strength, not trying to buy a declining stock. A check of Newmont's present chart and numbers shows a strong match with these rules:
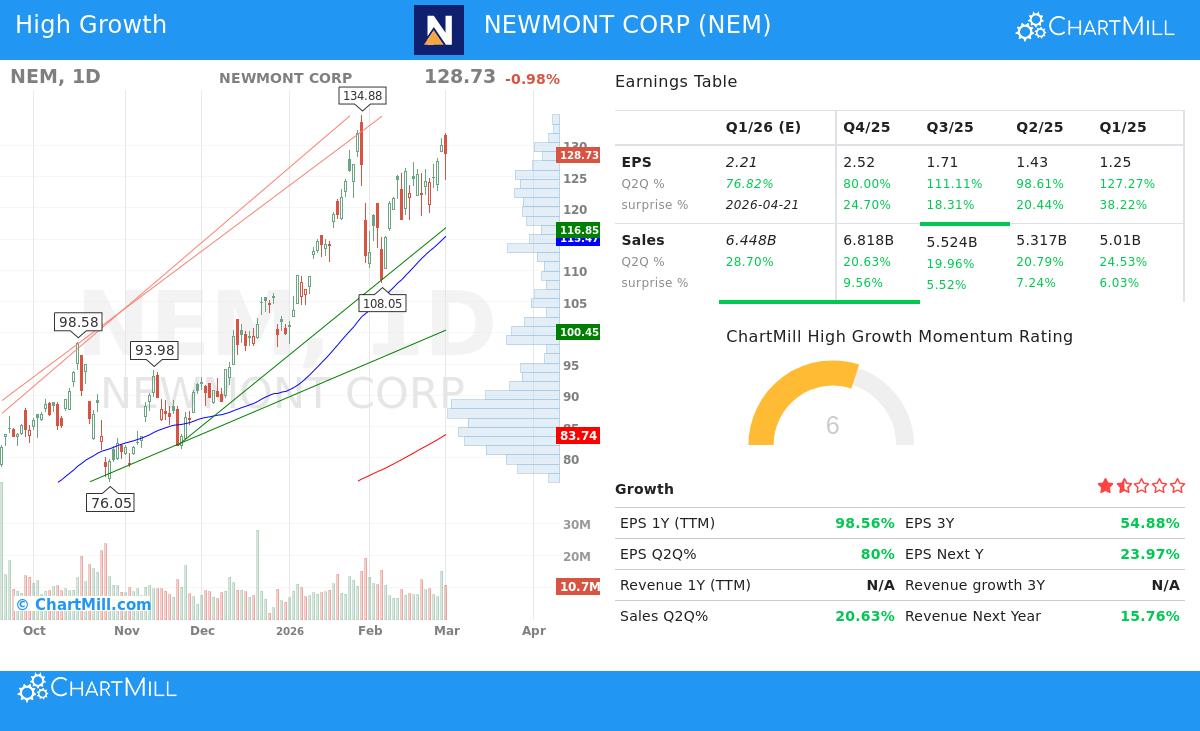
- Price Above Important Moving Averages: The stock's last price of $128.73 trades much above its rising 50-day ($115.47), 150-day ($92.79), and 200-day ($83.74) simple moving averages. This ordered position, with the shorter-term averages above the longer-term ones, is a standard mark of a firm uptrend.
- Nearness to Highs: At its present level, NEM is trading within 4.6% of its 52-week high of $134.88, easily meeting the "within 25% of its high" rule. More notably, the price is over 206% above its 52-week low of $42.03, greatly passing the 30% limit and indicating a strong recovery trend.
- Better Relative Strength: A ChartMill Relative Strength (CRS) score of 97.0 shows that NEM has done better than 97% of all stocks over the last year. This outstanding relative strength is a central idea of the Minervini view, which focuses on market leaders.
This grouping of points indicates Newmont is in a clear, long-term uptrend, meeting the technical needs that Minervini states are required before any basic study starts.
Studying High-Growth Momentum Basics
While the Trend Template deals with the "when," the "why" is frequently found in the basics. The High Growth Momentum (HGM) grade looks for companies showing quickening financial results, a main force behind continued stock price gains. Newmont's recent financial information shows several good catalysts:
- Large Earnings Growth: The company's trailing twelve-month (TTM) EPS of $6.91 shows year-over-year growth of 98.6%. This firm growth is not a single-quarter exception; the last four quarterly EPS results have shown year-over-year gains of 127.3%, 98.6%, 111.1%, and 80.0%, in order. Also, NEM has passed analyst EPS estimates in all of the last four quarters by an average of 26.3%.
- Firm and Getting Better Profitability: Profit margins have grown notably. The last reported quarterly profit margin was 33.2%, after margins of 38.8% and 37.7% in the two earlier quarters. This pattern shows working efficiency and pricing ability, which are important for maintaining growth.
- Positive Analyst Changes: Forward estimates are increasing, a main sign of gathering momentum. Analyst agreement estimates for next year's EPS have been changed upward by 3.2% over the last three months, suggesting more belief in the company's future earnings possibility.
- Firm Cash Flow Creation: Free cash flow per share has jumped by over 718% in the past year to $5.74, giving the company notable financial room for dividends, debt paydown, and strategic spending.
These measures show a company in a strong earnings quickening cycle, which is exactly what high-growth momentum plans try to find.
Technical Condition and Setup Summary
Following ChartMill's own study, Newmont's technical condition is very firm, getting a top Technical Rating of 10 out of 10. The report states both short-term and long-term trends are positive, and the stock is doing better than 97% of the market. Important support levels are found between $114.85-$116.85 and near $121.95, which could act as possible zones for the trend to recover during dips.
However, the report also gives a note of care for short-term traders: the Setup Quality Rating is now a 4. This shows that while the long-term trend is very good, the stock has been moving in a narrow range near its recent highs and may not offer a perfect, low-risk entry point for a new position at this exact time. The price has traded in a broad range over the past month and is now near the top of that range. For investors using a Minervini-type method, this suggests looking for a possible decrease in price swings or a good dip toward support within the continuing uptrend.
You can study the complete, detailed technical analysis for Newmont Corp on its own Technical Analysis Report page.
Locating Like Possibilities
Newmont Corp shows how the mix of a firm technical trend and quickening basic growth can find strong investment candidates. For investors wanting to use this two-step method to find other possible chances, the preset screen that featured NEM is ready to study.
You can find more stocks that meet both the Minervini Trend Template and High Growth Momentum rules by using this High Growth Momentum + Trend Template screen.
Disclaimer: This article is for information and learning only. It is not advice to buy or sell any security. The study is based on given information and certain methods, but past results do not show future outcomes. Always do your own study and think about talking with a qualified financial advisor before making any investment choices. Please read our full disclaimer here.