
For technical investors looking to find stocks ready for their next rise, a frequent method mixes two main ideas: trend strength and entry timing. The aim is to locate securities that are both in a verified, good uptrend and also moving out of a time of sideways action, giving a clear and lower-risk entry point. This method removes stocks in downtrends or those that are already far along and possibly overbought. By concentrating on stocks with good basic technical condition that are also making a constructive pattern, traders try to join in the continuation of a set trend.
NextEra Energy Inc (NYSE:NEE) recently appeared from a screen made to find such technical breakout chances. The screen uses ChartMill's own ratings to judge both the trend's soundness and the nature of the current price formation. A nearer view of the utility company's chart and technical report shows why it is notable as a pick for this method.
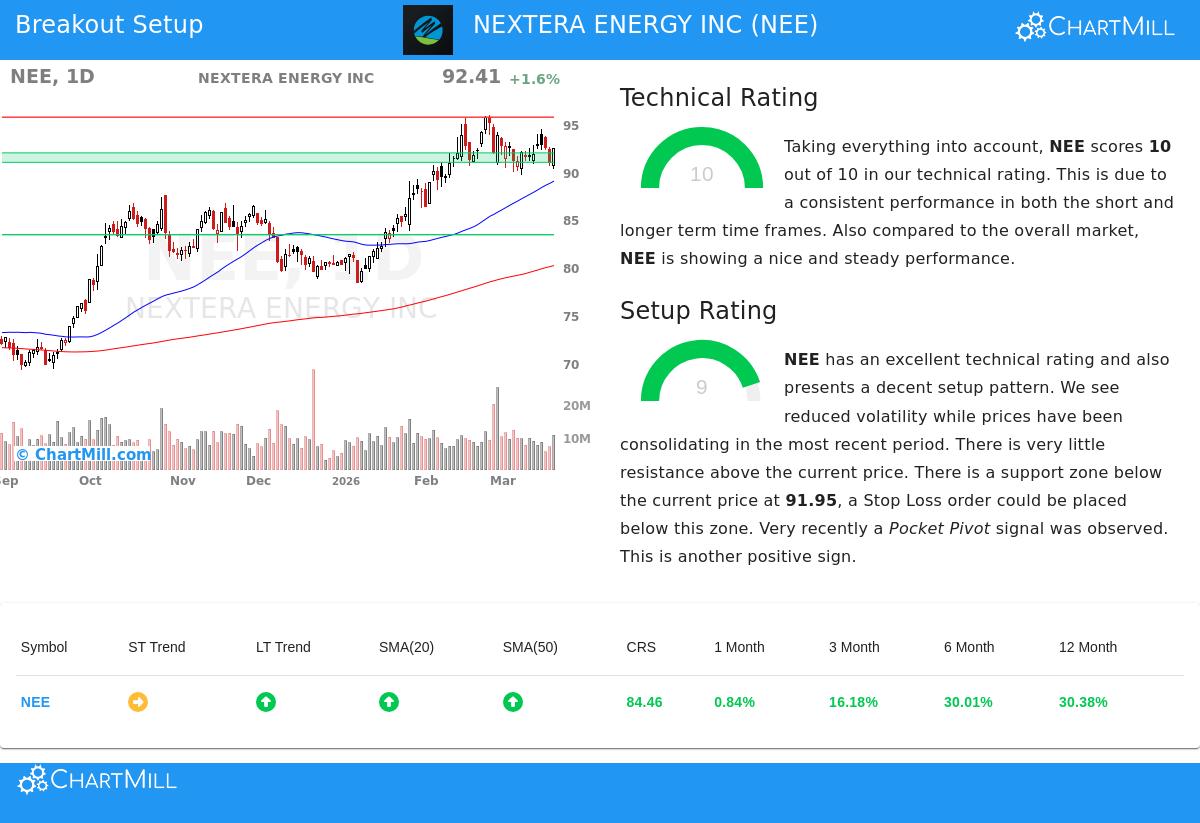
Judging the Basic Trend Strength
The base of any breakout trade is a stock showing solid technical condition. ChartMill's Technical Rating, which measures this strength on a scale from 0 to 10, is a central part of the screening process. A high rating is key because it shows the stock is a market leader with speed, raising the chance that a breakout will result in a continued move and not a failed signal.
NextEra Energy receives a complete Technical Rating of 10, putting it in the group of top performers from a technical view. The detailed technical report points out several parts adding to this high score:
- Steady Long-Term Uptrend: The long-term trend is called positive, with the stock price trading well above its important moving averages (50-day, 100-day, and 200-day SMAs), all of which are going up. This shows continued buying pressure over many time periods.
- Better Relative Strength: NEE's results are much stronger than both the wider market and its similar companies. Over the last year, it has done better than 84% of all stocks and 88% of other firms in the Electric Utilities field.
- Good Market Place: The stock is trading in the higher part of its 52-week range, matching with the S&P 500, which hints its strength is not a lone event but part of a wider market condition.
This mix of a forceful uptrend and notable relative results is just what the breakout method tries to catch, as it gives a good setting for the next possible gain.
Judging the Breakout Pattern Nature
While a strong trend is needed, it is not enough for a best trade. A stock can be technically good but too far along, leaving small space for a careful entry. This is where the Setup Quality Rating becomes key. It finds times of sideways or "tight" trading, which often come before a new directional move. A high setup score suggests the stock is winding up, giving a clear support level for a stop-loss order and a set resistance level to watch for a breakout.
NextEra Energy shows a Setup Quality Rating of 9, meaning a very good sideways pattern. The technical report states that prices have been in a range lately, with movement going down—a usual sign of a base being formed. Main parts of the pattern include:
- Set Trading Range: Over the last month, NEE has traded between about $89.65 and $95.91. It is now placed near the lower part of this range, closer to possible support.
- Clear Support and Resistance: The study finds an important support area between $90.96 and $91.95, made by a meeting of moving averages and trendlines. A major resistance level is at $95.68.
- Helpful Volume Activity: A recent "Pocket Pivot" signal was seen, which is a positive price/volume formation often pointing to gathering by big investors.
For a trader, this shape allows for a planned method: a buy order could be set just above the $95.68 resistance to confirm a breakout, with a protective stop-loss order set just below the $91.95 support area. This sets the risk from the start, a main part of technical trading.
A Pick for Watchlists
The meeting of a complete Technical Rating (10) and a nearly complete Setup Quality Rating (9) makes NextEra Energy an interesting chart for technical investors to watch. It shows a leading stock in its field that has stopped to gather force, possibly preparing for its next gain. The set levels on the chart give an objective plan for handling the trade, from entry to exit.
It is key to recall that no pattern assures a win. The wider market setting, with the S&P 500's long-term trend now negative, calls for care and shows the need for firm risk control. Traders should always do their own study and know of coming company-specific events, like earnings reports.
Interested in finding other stocks showing similar technical signs? You can run the Technical Breakout Setups screen yourself to find new ideas daily via this link.
,
Disclaimer: This article is for information only and does not make investment advice, a suggestion, or an offer to buy or sell any security. The study shown is based on technical measures and should not be the only base for an investment choice. All trading and investment choices include risk, including the possible loss of principal. Readers should do their own research and talk with a qualified financial advisor before making any investment choices.