
Uncover the potential of NEUROCRINE BIOSCIENCES INC (NASDAQ:NBIX) as our stock screener's choice for an undervalued stock. NBIX maintains a strong financial position and offers an appealing valuation. We'll delve into the specifics below.
Assessing Valuation for NBIX
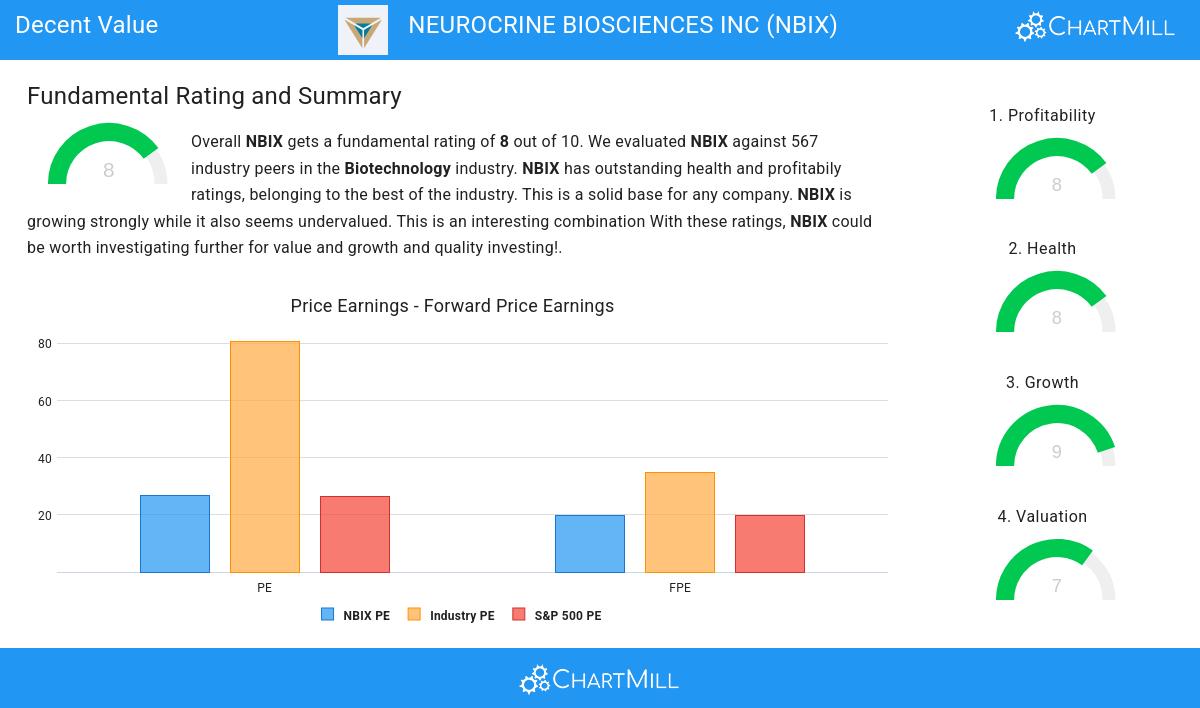
To assess a stock's valuation, ChartMill utilizes a Valuation Rating on a scale of 0 to 10. This comprehensive assessment considers various valuation aspects, comparing price to earnings and cash flows, while factoring in profitability and growth. NBIX has achieved a 7 out of 10:
- 94.71% of the companies in the same industry are more expensive than NBIX, based on the Price/Earnings ratio.
- NBIX's Price/Forward Earnings ratio is rather cheap when compared to the industry. NBIX is cheaper than 94.00% of the companies in the same industry.
- Based on the Enterprise Value to EBITDA ratio, NBIX is valued cheaper than 96.83% of the companies in the same industry.
- Based on the Price/Free Cash Flow ratio, NBIX is valued cheaper than 95.94% of the companies in the same industry.
- NBIX's low PEG Ratio(NY), which compensates the Price/Earnings for growth, indicates a rather cheap valuation of the company.
- The excellent profitability rating of NBIX may justify a higher PE ratio.
- A more expensive valuation may be justified as NBIX's earnings are expected to grow with 40.33% in the coming years.
Profitability Insights: NBIX
ChartMill employs its own Profitability Rating system for stock evaluation. This score, ranging from 0 to 10, is derived from an analysis of diverse profitability metrics and margins. In the case of NBIX, the assigned 8 is noteworthy for profitability:
- Looking at the Return On Assets, with a value of 9.18%, NBIX belongs to the top of the industry, outperforming 95.24% of the companies in the same industry.
- NBIX's Return On Equity of 13.18% is amongst the best of the industry. NBIX outperforms 94.89% of its industry peers.
- NBIX has a Return On Invested Capital of 13.20%. This is amongst the best in the industry. NBIX outperforms 96.47% of its industry peers.
- The 3 year average ROIC (11.40%) for NBIX is below the current ROIC(13.20%), indicating increased profibility in the last year.
- NBIX's Profit Margin of 14.49% is amongst the best of the industry. NBIX outperforms 95.59% of its industry peers.
- In the last couple of years the Profit Margin of NBIX has grown nicely.
- NBIX has a Operating Margin of 24.75%. This is amongst the best in the industry. NBIX outperforms 96.83% of its industry peers.
- NBIX has a Gross Margin of 98.56%. This is amongst the best in the industry. NBIX outperforms 97.35% of its industry peers.
Understanding NBIX's Health
To gauge a stock's financial health, ChartMill utilizes a Health Rating on a scale of 0 to 10. This comprehensive evaluation encompasses liquidity and solvency, both in absolute terms and in comparison to industry peers. NBIX has earned a 8 out of 10:
- NBIX has an Altman-Z score of 6.19. This indicates that NBIX is financially healthy and has little risk of bankruptcy at the moment.
- NBIX's Altman-Z score of 6.19 is amongst the best of the industry. NBIX outperforms 86.07% of its industry peers.
- NBIX has no outstanding debt. Therefor its Debt/Equity and Debt/FCF ratios are 0 and belong to the best of the industry.
- NBIX has a Current Ratio of 3.40. This indicates that NBIX is financially healthy and has no problem in meeting its short term obligations.
- NBIX has a Quick Ratio of 3.28. This indicates that NBIX is financially healthy and has no problem in meeting its short term obligations.
Assessing Growth for NBIX
ChartMill assigns a proprietary Growth Rating to each stock. The score is computed by evaluating various growth aspects, like EPS and revenue growth. We take into account the history as well as the estimated future numbers. NBIX was assigned a score of 9 for growth:
- NBIX shows a strong growth in Earnings Per Share. In the last year, the EPS has been growing by 35.95%, which is quite impressive.
- Measured over the past years, NBIX shows a very strong growth in Earnings Per Share. The EPS has been growing by 58.39% on average per year.
- Looking at the last year, NBIX shows a very strong growth in Revenue. The Revenue has grown by 24.81%.
- The Revenue has been growing by 24.48% on average over the past years. This is a very strong growth!
- NBIX is expected to show a strong growth in Earnings Per Share. In the coming years, the EPS will grow by 38.49% yearly.
- Based on estimates for the next years, NBIX will show a quite strong growth in Revenue. The Revenue will grow by 12.86% on average per year.
Every day, new Decent Value stocks can be found on ChartMill in our Decent Value screener.
Our latest full fundamental report of NBIX contains the most current fundamental analsysis.
Disclaimer
This is not investing advice! The article highlights some of the observations at the time of writing, but you should always make your own analysis and invest based on your own insights.