
Consider MSC INDUSTRIAL DIRECT CO-A (NYSE:MSM) as a top pick for dividend investors, identified by our stock screening tool. MSM shines in terms of profitability, solvency, and liquidity, all while paying a decent dividend. Let's dive deeper into the analysis.
Evaluating Dividend: MSM
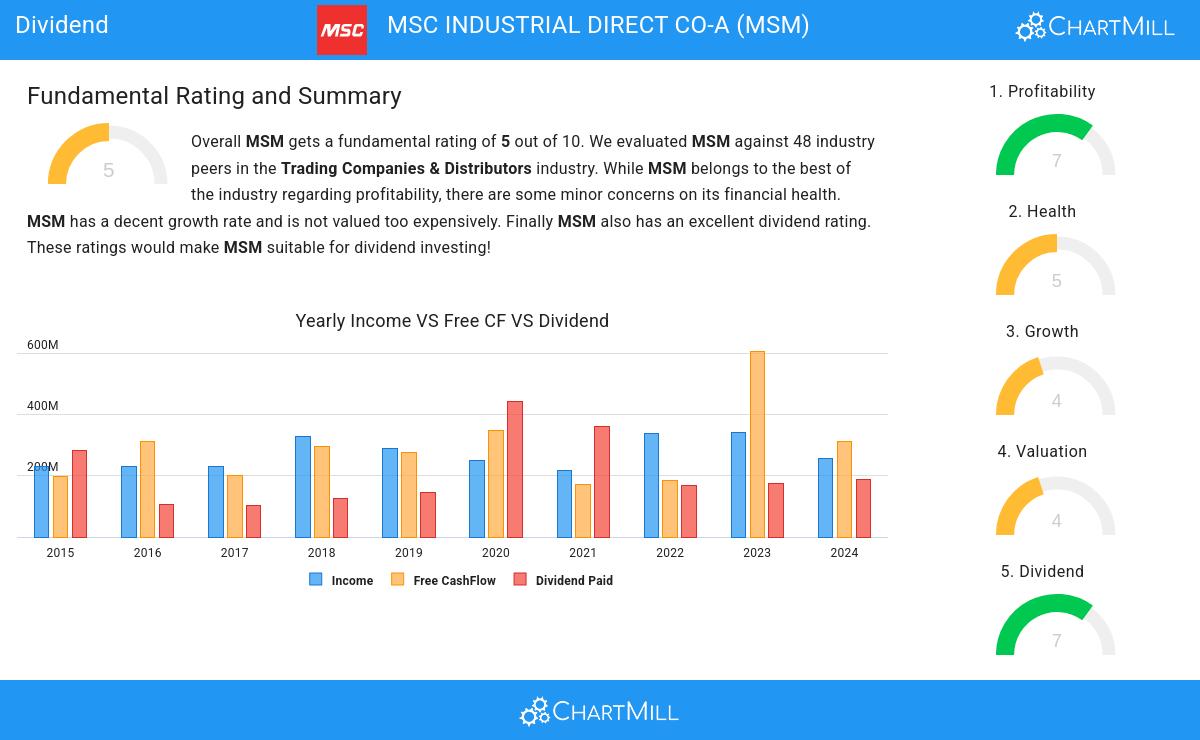
ChartMill assigns a proprietary Dividend Rating to each stock. The score is computed by evaluating various valuation aspects, like the yield, the history, the dividend growth and sustainability. MSM was assigned a score of 7 for dividend:
- MSM has a Yearly Dividend Yield of 4.77%, which is a nice return.
- MSM's Dividend Yield is rather good when compared to the industry average which is at 2.25. MSM pays more dividend than 93.75% of the companies in the same industry.
- Compared to an average S&P500 Dividend Yield of 2.44, MSM pays a better dividend.
- MSM has been paying a dividend for at least 10 years, so it has a reliable track record.
- The dividend of MSM is growing, but earnings are growing more, so the dividend growth is sustainable.
A Closer Look at Health for MSM
ChartMill utilizes a Health Rating to assess stocks, scoring them on a scale of 0 to 10. This rating takes into account a variety of liquidity and solvency ratios, both in absolute terms and in comparison to industry peers. MSM has earned a 5 out of 10:
- An Altman-Z score of 4.63 indicates that MSM is not in any danger for bankruptcy at the moment.
- MSM has a better Altman-Z score (4.63) than 75.00% of its industry peers.
- MSM has a debt to FCF ratio of 1.79. This is a very positive value and a sign of high solvency as it would only need 1.79 years to pay back of all of its debts.
- MSM's Debt to FCF ratio of 1.79 is fine compared to the rest of the industry. MSM outperforms 79.17% of its industry peers.
- A Debt/Equity ratio of 0.22 indicates that MSM is not too dependend on debt financing.
- MSM has a Debt to Equity ratio of 0.22. This is in the better half of the industry: MSM outperforms 68.75% of its industry peers.
How do we evaluate the Profitability for MSM?
ChartMill assigns a Profitability Rating to every stock. This score ranges from 0 to 10 and evaluates the different profitability ratios and margins, both absolutely, but also relative to the industry peers. MSM scores a 7 out of 10:
- MSM has a better Return On Assets (8.66%) than 77.08% of its industry peers.
- MSM's Return On Equity of 15.73% is fine compared to the rest of the industry. MSM outperforms 64.58% of its industry peers.
- Looking at the Return On Invested Capital, with a value of 14.01%, MSM belongs to the top of the industry, outperforming 85.42% of the companies in the same industry.
- The Average Return On Invested Capital over the past 3 years for MSM is significantly above the industry average of 9.26%.
- MSM has a Profit Margin of 5.69%. This is in the better half of the industry: MSM outperforms 64.58% of its industry peers.
- The Operating Margin of MSM (9.17%) is better than 60.42% of its industry peers.
- MSM has a better Gross Margin (40.90%) than 72.92% of its industry peers.
Every day, new Best Dividend stocks can be found on ChartMill in our Best Dividend screener.
Our latest full fundamental report of MSM contains the most current fundamental analsysis.
Keep in mind
Important Note: The content of this article is not intended as trading advice. It is essential to perform your own analysis and exercise caution when making trading decisions. The article presents observations created by automated analysis but does not guarantee any trading or investment outcomes. Always trade responsibly and make independent judgments.