
MSC INDUSTRIAL DIRECT CO-A (NYSE:MSM) is a hidden gem unveiled by our stock screening tool, featuring a promising dividend outlook alongside solid fundamentals. MSM demonstrates decent financial health and profitability while ensuring a sustainable dividend. Let's break it down further.
Exploring MSM's Dividend
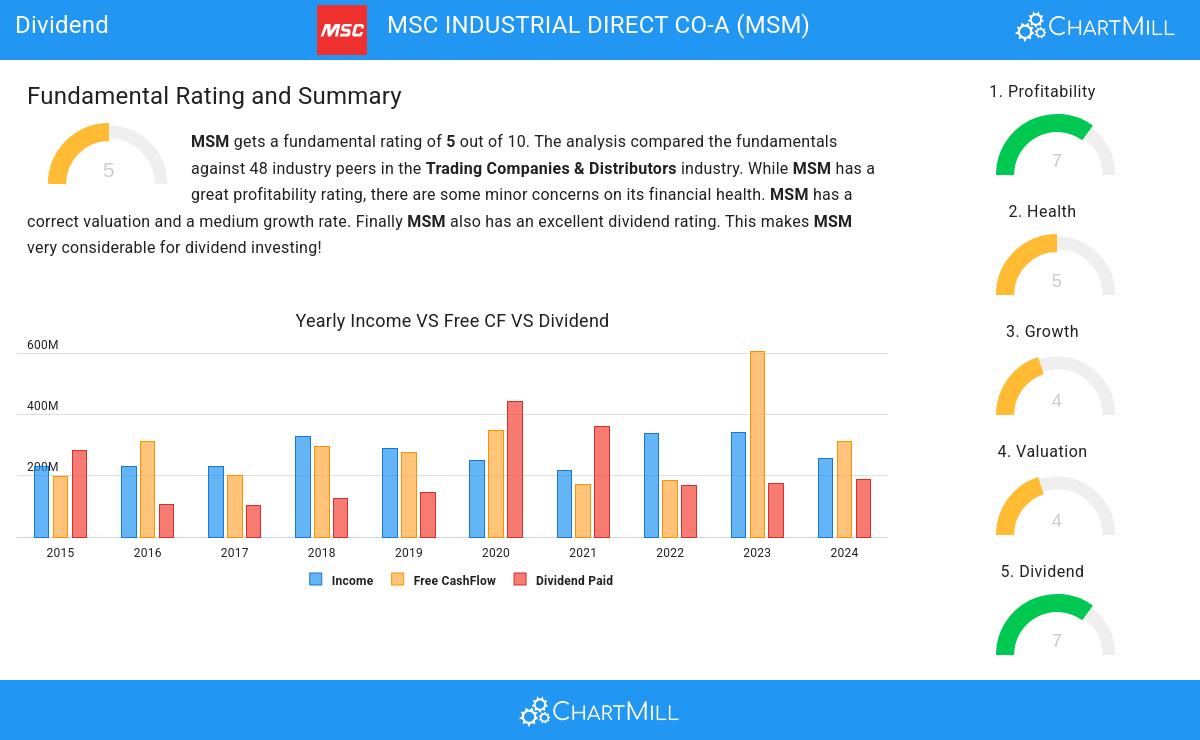
ChartMill assigns a Dividend Rating to each stock, ranging from 0 to 10. This rating is calculated by analyzing various dividend elements, such as yield, historical performance, dividend growth, and sustainability. MSM has been awarded a 7 for its dividend quality:
- MSM has a Yearly Dividend Yield of 4.57%, which is a nice return.
- Compared to an average industry Dividend Yield of 2.13, MSM pays a better dividend. On top of this MSM pays more dividend than 91.67% of the companies listed in the same industry.
- Compared to an average S&P500 Dividend Yield of 2.39, MSM pays a better dividend.
- MSM has been paying a dividend for at least 10 years, so it has a reliable track record.
- MSM's earnings are growing more than its dividend. This makes the dividend growth sustainable.
Health Examination for MSM
Every stock is evaluated by ChartMill, receiving a Health Rating on a scale of 0 to 10. This assessment considers different health aspects, including liquidity and solvency, both in absolute terms and relative to industry peers. MSM has achieved a 5 out of 10:
- An Altman-Z score of 4.92 indicates that MSM is not in any danger for bankruptcy at the moment.
- MSM has a Altman-Z score of 4.92. This is amongst the best in the industry. MSM outperforms 81.25% of its industry peers.
- MSM has a debt to FCF ratio of 1.57. This is a very positive value and a sign of high solvency as it would only need 1.57 years to pay back of all of its debts.
- The Debt to FCF ratio of MSM (1.57) is better than 79.17% of its industry peers.
- A Debt/Equity ratio of 0.21 indicates that MSM is not too dependend on debt financing.
- With a decent Debt to Equity ratio value of 0.21, MSM is doing good in the industry, outperforming 68.75% of the companies in the same industry.
Exploring MSM's Profitability
ChartMill employs its own Profitability Rating system for stock evaluation. This score, ranging from 0 to 10, is derived from an analysis of diverse profitability metrics and margins. In the case of MSM, the assigned 7 is noteworthy for profitability:
- Looking at the Return On Assets, with a value of 9.54%, MSM belongs to the top of the industry, outperforming 81.25% of the companies in the same industry.
- The Return On Equity of MSM (17.15%) is better than 70.83% of its industry peers.
- MSM's Return On Invested Capital of 15.34% is amongst the best of the industry. MSM outperforms 89.58% of its industry peers.
- MSM had an Average Return On Invested Capital over the past 3 years of 17.86%. This is significantly above the industry average of 8.84%.
- The Profit Margin of MSM (6.21%) is better than 66.67% of its industry peers.
- Looking at the Operating Margin, with a value of 9.96%, MSM is in the better half of the industry, outperforming 68.75% of the companies in the same industry.
- MSM's Gross Margin of 41.05% is fine compared to the rest of the industry. MSM outperforms 75.00% of its industry peers.
Every day, new Best Dividend stocks can be found on ChartMill in our Best Dividend screener.
For an up to date full fundamental analysis you can check the fundamental report of MSM
Keep in mind
This is not investing advice! The article highlights some of the observations at the time of writing, but you should always make your own analysis and invest based on your own insights.