
Investors aiming to benefit from companies with increasing business momentum often use a method that combines fundamental and technical analysis. The objective is to find stocks that are not only expanding their earnings and revenue at a rate faster than average but are also reaching a point where market opinion is improving, shown by their price movement. This method selects for stocks with good basic business condition and earnings, making sure the expansion is lasting, while also searching for technical chart formations that indicate the stock is starting a new rising trend. This combination of solid fundamentals and positive technical signs can point to a noteworthy chance for investors focused on expansion.
McKesson Corp (NYSE:MCK) serves as an example for this approach. As a key part of the healthcare supply system, McKesson’s business is necessary, but recent results show it is also a story of active expansion. The company’s newest outcomes and technical path give a concrete instance of how measured expansion standards and chart formations can come together.
Fundamental Expansion Strength
A basic part of this method is finding companies with clear and anticipated expansion. McKesson’s fundamental report shows a good expansion profile that warrants investor notice. The company’s ChartMill Growth Rating is a firm 7 out of 10, indicating good results in both recent performance and future outlook.
- Past Performance: McKesson has produced notable results, with Earnings Per Share (EPS) expanding by 25.63% over the last year and Revenue rising by 17.23%. The longer-term patterns are also noteworthy, with an average yearly EPS expansion of 17.17% and Revenue expansion of 9.22% over recent years.
- Future Outlook: Analysts expect this momentum to persist. Estimates point to an average yearly EPS expansion of 13.83% and Revenue expansion of 8.52% in the next years. This steadiness between past success and future outlook is an important qualitative factor for lasting expansion, as it indicates the company’s growth is not a temporary occurrence but part of a stable pattern.
This expansion is happening inside a large and steady target market, global healthcare, which offers a long path for growth. You can examine the complete details of McKesson’s fundamentals, including its earnings and financial condition scores, in its detailed fundamental analysis report.
Supporting Fundamentals: Valuation and Financial Condition
While expansion is the main factor, the method demands that this expansion be backed by fair valuation and sufficient financial condition to reduce risk. McKesson’s profile here is varied but acceptable for a screen focused on expansion.
- Valuation: With a P/E ratio of 23.17, McKesson is valued similarly to the wider S&P 500 and is seen as somewhat inexpensive compared to others in its industry. Its forward P/E of 18.99 is also lower than the market average. For expansion investors, a fair valuation is important; paying too much for expansion can greatly reduce future gains even if the company performs well.
- Financial Condition & Earnings: The company gets an average score of 5 for Financial Condition. A notable issue is liquidity, with Current and Quick Ratios under 1.0, which is typical in distribution businesses with few assets but needs watching. On the positive side, its ability to pay debts is very good, with a strong Altman-Z score and a very low Debt-to-Free-Cash-Flow ratio of 1.29, showing a strong capacity to handle its debts. Earnings, rated a 6, is marked by a very good Return on Invested Capital (ROIC) of 26.27%, which is much higher than its cost of capital, a clear signal the company is generating value for shareholders.
Positive Technical Breakout Formation
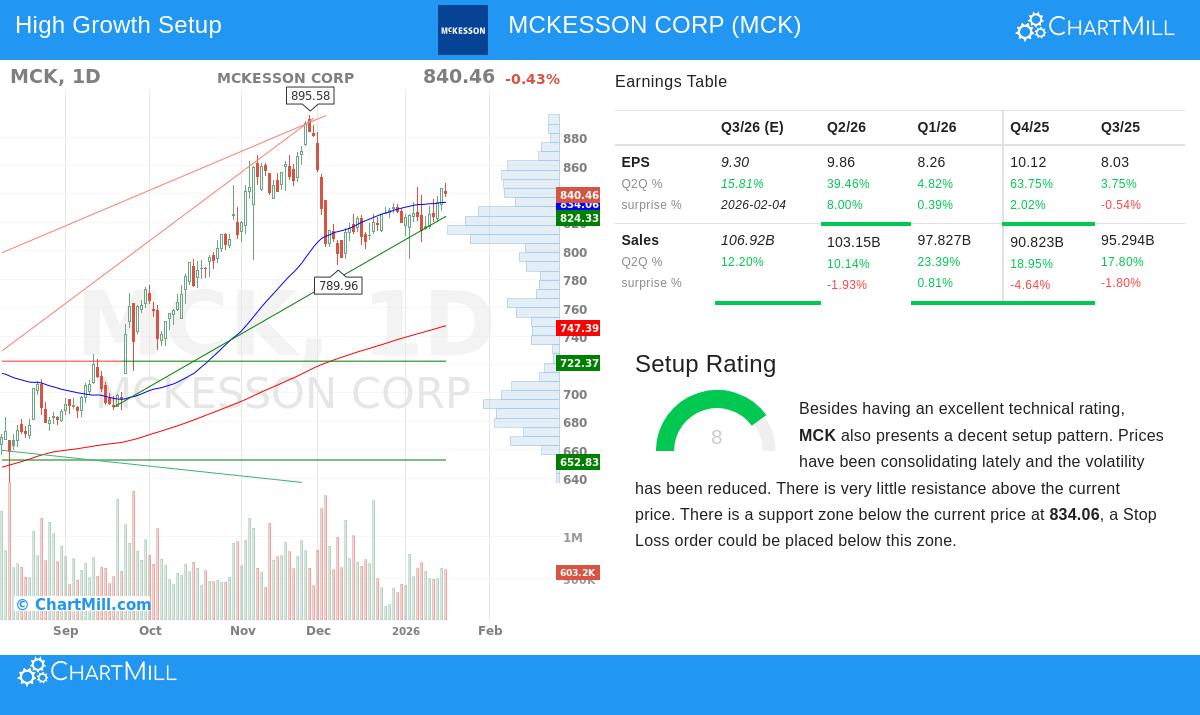
The technical analysis part tries to find the best time when market view matches the fundamental story. McKesson’s technical report shows a clearly positive image, with a high ChartMill Technical Rating of 9 and a Setup Rating of 8.
- Good Trend Agreement: Both the short-term and long-term trends for MCK are positive, a strong mix that shows continued buying interest across different time frames. The stock is trading above its important moving averages (20, 100, and 200-day), which are all increasing, confirming the rising trend’s strength.
- Narrowing Range and Breakout Chance: The report states that McKesson has been trading in a band between about $794 and $848 over the last month and is now testing the top of this band. This time of lower volatility and narrowing range near highs often comes before a possible breakout. The technical formation identifies very little price blockage above the current price, indicating a move above the recent high could start a notable upward move.
- Market and Comparative Strength: McKesson is doing better than 84% of all stocks in the market over the last year and 75% of its healthcare services industry group. This good comparative strength is a characteristic of leading expansion stocks. While the S&P 500 itself is in a positive trend, McKesson’s performance shows it is gaining more than its share of the market’s positive momentum.
The specific entry and exit points described in the technical analysis report give a tactical plan for investors who view this combination of factors as a reason to act.
Conclusion
McKesson Corp represents the kind of chance a mixed fundamental and technical screen intends to find. The company has the measured expansion qualifications, strong historical and estimated rises in sales and earnings, that are necessary for an expansion investment idea. These fundamentals are set within the large, steady healthcare market, giving a qualitative benefit. Technically, the stock is in a confirmed rising trend and is tightening near an important resistance point, indicating a possible breakout that could speed its price increase. While investors must always think about risks, like the company’s low liquidity ratios, the overall view is of a financially stable company performing well and receiving market approval.
This review of McKesson came from a methodical screening process. If you want to find other stocks that match this profile of solid expansion combined with positive technical formations, you can investigate the predefined screen here.
Disclaimer: This article is for information only and does not form investment advice, a suggestion, or an offer to buy or sell any security. The analysis is based on data and reports given by other parties. Investors should do their own complete research and think about their personal financial situation and risk tolerance before making any investment choices. Past performance does not guarantee future results.