
Investors aiming to benefit from the next group of market leaders frequently use a two-part method, joining the prospective view of fundamental analysis with the timing clues from technical patterns. One specific tactic looks for stocks with solid growth that are also showing favorable technical breakout formations. The idea is simple: find firms with good and improving business foundations, like earnings expansion, firm profitability, and sound finances, and then watch for the price movement to signal a possible rise. This approach tries to find stocks that are both fundamentally healthy and beginning to gain speed, possibly giving a point to enter before a notable price increase.
McKesson Corp (NYSE:MCK) functions centrally in the healthcare supply chain, offering pharmaceutical distribution, medical-surgical supply answers, and healthcare technology services. As a key part of a large and necessary field, the firm's results are linked to wider healthcare patterns and activity levels.
Fundamental Growth Strength
The base of this screening tactic is finding firms with high-quality growth measures, and McKesson's fundamental picture shows clear force here. Based on its fundamental analysis report, the firm gets a Growth Rating of 7 out of 10, showing results notably better than its industry group.
Important growth factors are:
- Notable Earnings Increase: McKesson's Earnings Per Share (EPS) rose by 25.63% over the last year, with a 3-year average yearly growth rate of 17.17%. This shows a strong and continuing rise in profitability.
- Firm Revenue Growth: The company's top line is also growing firmly, with revenue going up by 17.23% in the past year and averaging 9.22% growth each year over the last three years.
- Positive Future Expectation: Analysts think this pace will keep going, with estimated yearly EPS growth of 13.83% and revenue growth of 8.52% in the next years.
This steady performance is vital for a growth stock, as it confirms the firm's business plan and its capacity to grow profitably within its big market, an important quality aspect for lasting growth.
Supporting Fundamentals: Profitability and Health
While growth is the main screen, the method also needs "acceptable" supporting basics to reduce risk. McKesson shows an even view here, with both its Profitability and Financial Health ratings at 6 out of 10.
The profitability picture is varied but has a notable measure:
- The firm's Return on Invested Capital (ROIC) of 26.27% is very good, doing better than 97% of its industry group. This points to very effective use of capital to create profits.
- Margins, however, are standard for the low-margin, high-volume distribution business, with profit and operating margins near industry averages.
From a financial health view, the study shows a split:
- Firm Solvency: McKesson has a very good Altman-Z score (5.71) and a very low Debt-to-Free-Cash-Flow ratio (1.29), hinting at a low chance of financial trouble and a good ability to handle its debt.
- Liquidity Note: The firm's current and quick ratios are below 1.0, which is a point of watchfulness and usual in businesses that handle big inventories with effective cash conversion cycles. This is an area for investors to note, though it is balanced by the firm overall solvency measures.
Technical Breakout Setup
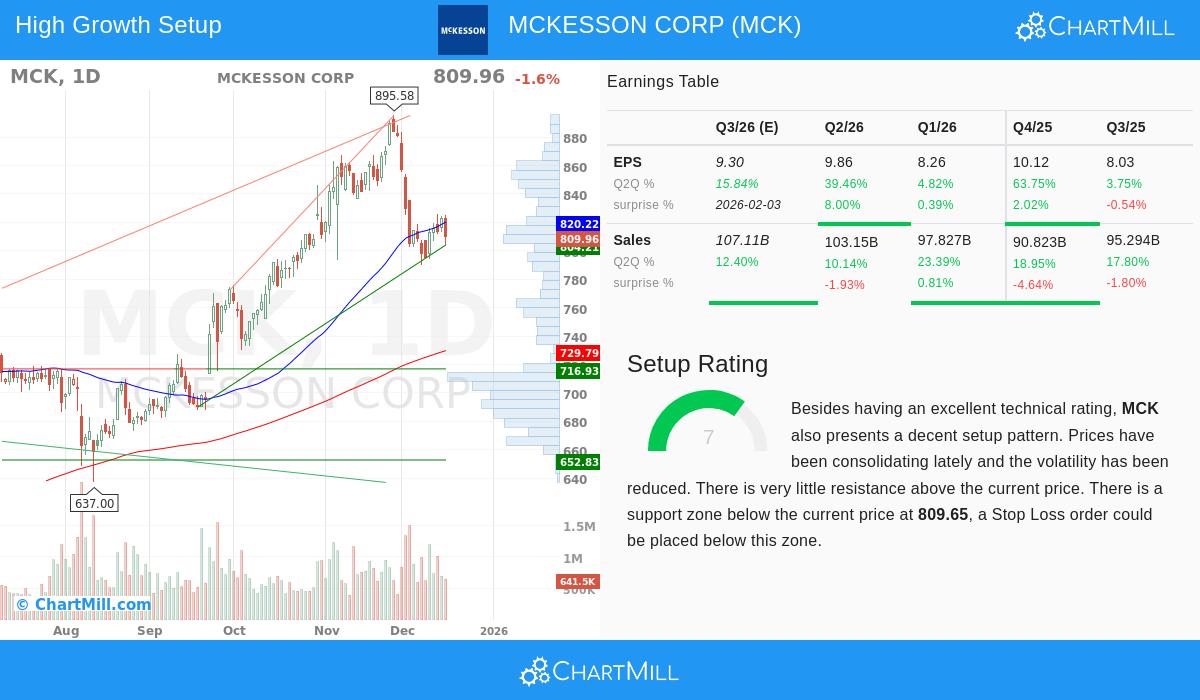
A good fundamental story needs a technical trigger, and McKesson's chart is now showing what technical analysts call a "setup." The stock's technical analysis report gives a firm Setup Rating of 7, hinting the situation may be coming together for a possible move.
The technical view shows:
- Narrowing in an Uptrend: The long-term direction stays positive, but the stock has lately moved back and started a period of narrowing, trading in a fairly tight band. This pause often happens after a firm rise and can come before the next step up.
- Lowered Volatility: During this narrowing, price movement has lessened. This coiling action can sometimes gather force for a clear breakout.
- Clear Support and Resistance: The technical study finds a close support area around $795 - $810, made by a mix of moving averages and trendlines. A stay above this area could give a base. Importantly, the report states there is "very little resistance above the current price," suggesting a breakout might meet little selling pressure on its way higher.
Valuation Context
For growth investors, price is always a thought to avoid paying too much for future possibility. McKesson's Valuation Rating is a neutral 5. While its P/E ratio of 22.33 seems high alone, it is actually lower priced than 63% of its industry group and is similar to the wider S&P 500 average. Also, when growth is considered through the PEG ratio, the price seems more fair, especially given the firm's high ROIC and double-digit earnings growth forecasts.
Conclusion
McKesson Corp presents a situation that matches the ideas of a joined growth and speed method. The firm shows very good, quickening growth in both earnings and revenue, backed by outstanding capital efficiency. Its financial health is firm regarding solvency, giving a base for that growth, even as its liquidity measures show the character of its distribution business. Technically, the stock is pausing inside a longer-term upward direction, offering a specific setup where a hold above support could mark the next stage of progress.
This mix of good fundamentals and a helpful technical position makes McKesson a stock worth more study for investors using this structured, two-analysis method.
Interested in finding more stocks that match this description? You can use the "Strong Growth Stocks with good Technical Setup Ratings" screen yourself to see other possible chances. Click here to view the screen and its current results.
Disclaimer: This article is for information only and does not form financial advice, a suggestion, or an offer or request to buy or sell any securities. The information shown is based on given data and should not be the only ground for any investment choice. Investing includes risk, including the possible loss of principal. Always do your own full study and think about talking with a qualified financial advisor before making any investment choices.