
The strategy of combining technical and fundamental analysis offers investors a complete approach to identifying potential opportunities in the equity markets. By focusing on stocks showing strong growth fundamentals next to favorable technical patterns, this method seeks to capture companies set for both operational excellence and positive momentum. One security that recently surfaced through such a screening process is Moelis & Co - Class A (NYSE:MC), an investment banking firm specializing in advisory services.
Fundamental Strength Supporting Growth Thesis
Moelis & Co shows notable growth characteristics that form the base of this investment thesis. The company's fundamental profile reveals exceptional revenue growth of 42.85% over the past year, significantly outpacing many industry peers. This solid expansion is matched by impressive return metrics, including a Return on Equity of 38.39% that places it in the top tier of capital markets firms. The growth narrative extends beyond historical performance, with analysts projecting 33.52% annual EPS growth and 21.69% revenue growth in coming years, indicating sustained momentum rather than isolated quarterly outperformance.
The company maintains a clean balance sheet with no outstanding debt, providing financial flexibility to manage market cycles while investing in future growth initiatives. While profitability metrics show some mixed signals with margin pressures in certain areas, the overall growth trajectory and strong returns on capital suggest a company effectively balancing expansion with operational efficiency. These fundamental qualities align well with growth investing principles, where investors look for companies capable of delivering above-average expansion in both earnings and market valuation.
Technical Setup Indicating Momentum Breakout
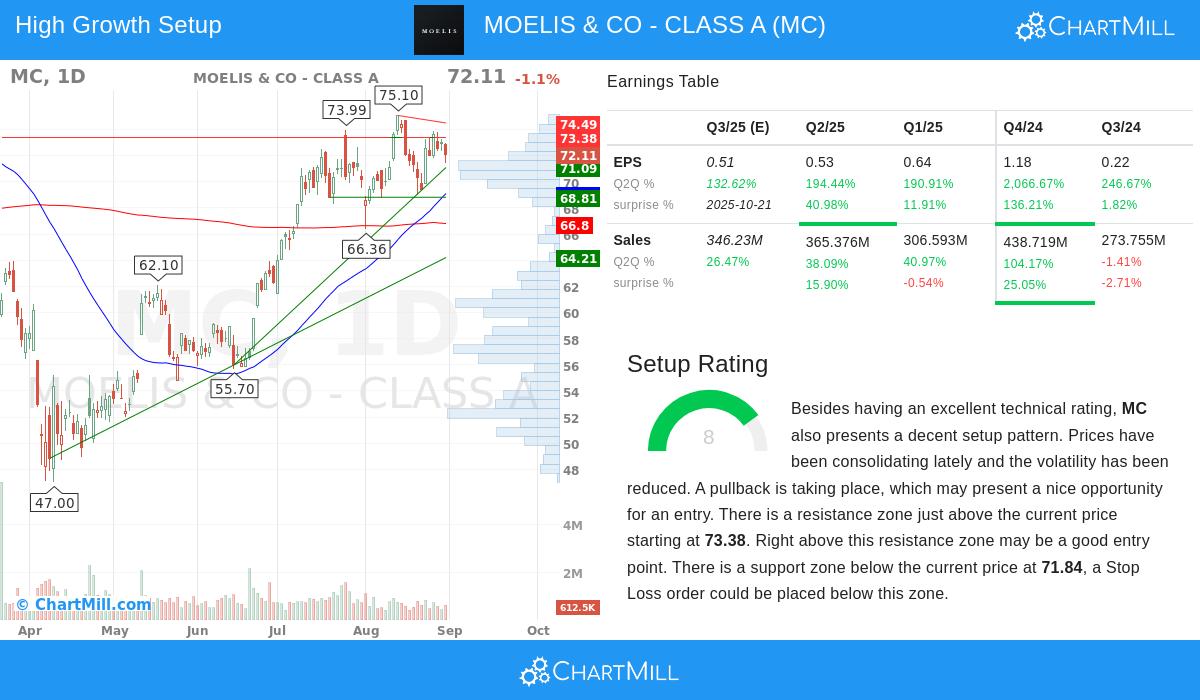
From a technical perspective, Moelis presents an attractive setup that matches its fundamental strengths. The stock currently trades with both short-term and long-term trends in positive territory, indicating alignment across different time horizons. Price action has been consolidating within a defined range between $68.28 and $75.10 over the past month, creating a base that often comes before significant moves. The current positioning in the middle of this range, combined with reduced volatility, suggests a potential coiled-spring effect awaiting catalyst-driven movement.
The technical analysis reveals clear support levels around $71.84, providing a logical stop-loss area for risk management, while resistance sits near $75.41, a breakout above which could signal renewed momentum. This technical pattern is particularly noteworthy given the stock's relative strength outperforming 72% of its capital markets industry peers, demonstrating that the price action reflects company-specific strength rather than broad sector tailwinds. The setup suggests the stock may be preparing for its next leg higher, potentially offering an advantageous risk-reward entry point for growth-oriented investors.
Integrated Analysis Creating Conviction
The combination of strong fundamental growth metrics and constructive technical positioning creates a notable investment case. The fundamental analysis report highlights MC's exceptional growth characteristics while acknowledging areas where the company shows average performance relative to industry standards. This balanced assessment provides credibility to the growth narrative rather than presenting an overly optimistic view.
Simultaneously, the technical analysis report confirms that market participants are beginning to recognize this fundamental story, with price action showing accumulation characteristics and trend strength. The convergence of these analytical approaches reduces the likelihood of value traps, situations where strong fundamentals fail to translate into price appreciation, while also avoiding purely technical plays lacking fundamental support.
This integrated approach is particularly valuable in current market conditions, where the S&P 500 shows positive trends in both short-term and long-term timeframes, creating a supportive environment for growth stocks exhibiting breakout patterns. The methodology ensures that selected securities possess both the operational excellence to sustain growth and the market recognition to drive price appreciation.
For investors interested in exploring similar opportunities that combine strong growth fundamentals with favorable technical setups, additional screening results are available through this customized stock screener.
Disclaimer: This analysis is provided for informational purposes only and does not constitute investment advice, recommendation, or endorsement of any security. Investors should conduct their own research and consult with a qualified financial advisor before making investment decisions. Past performance is not indicative of future results.