
For technical investors, spotting stocks that are in a solid trend and ready for their next move is a central tactic. One organized way is to look for stocks with very good technical condition and a defined, useful price formation. This process uses two main proprietary measures: the ChartMill Technical Rating, which measures the force and course of a stock's trend, and the ChartMill Setup Quality Rating, which judges the condition of its present pause formation. The aim is to locate market leaders in clear upward trends that are forming a tighter pattern, offering a possible moment to enter for a move higher.
A recent search using this process has pointed to SOUTHWEST AIRLINES CO (NYSE:LUV) as a notable candidate. The airline's stock shows the exact mix of solid momentum and positive price movement that technical traders look for when considering possible moves higher.
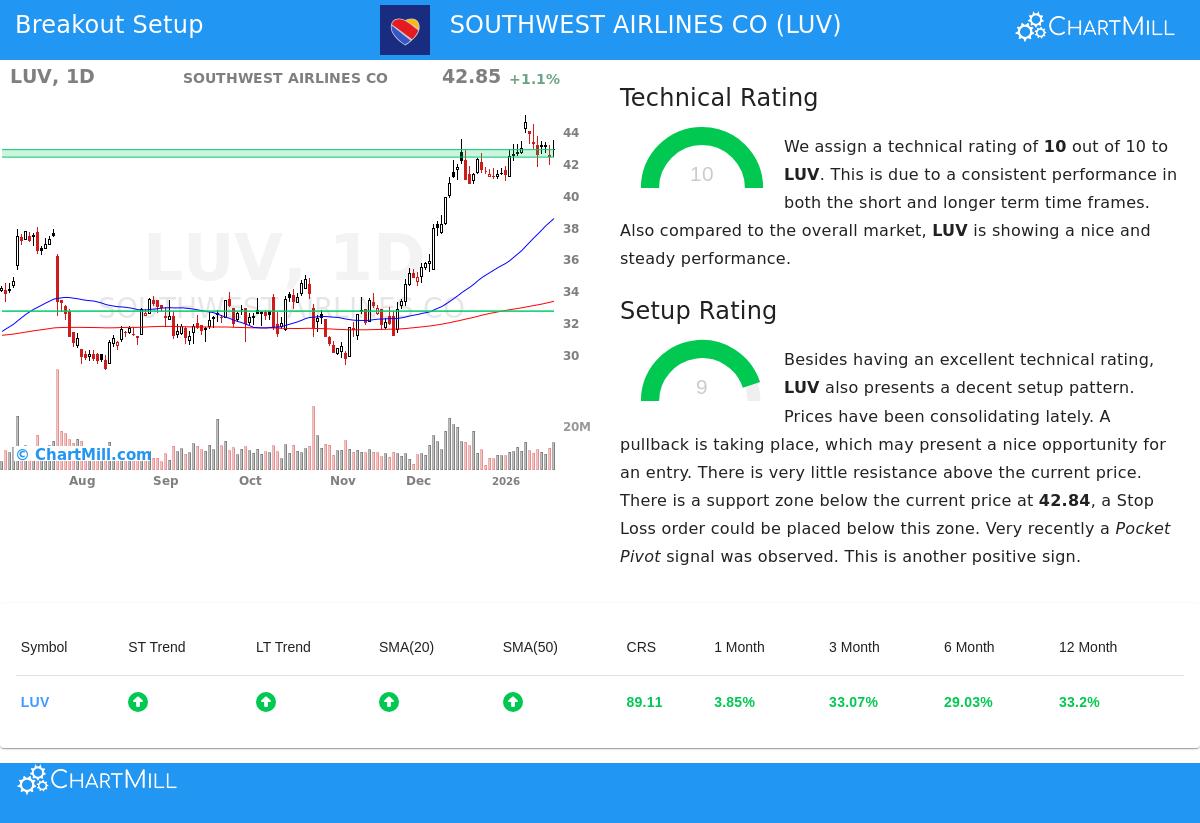
Technical Force: A Highest-Level Rating
The base of any trade for a move higher is a stock with clear upward momentum. The ChartMill Technical Rating for LUV is a full 10 out of 10, putting it with the market's best performers from a technical view. This top score is not given easily; it shows force across many time periods and indicators.
- Trend Agreement: Both the near-term and longer-term trends for LUV are scored as positive. This agreement is a strong sign, showing that momentum is steady from daily charts to weekly and monthly views, lowering the chance of mixed signals.
- Relative Performance: LUV is doing better than 89% of all stocks in the market over the last year and 85% of its group in the Passenger Airlines industry. This shows that its upward move is not just because of a rising market but real strength inside its sector.
- Moving Average Backing: The stock is priced above all its important simple moving averages (20, 50, 100, and 200-day), and each of these averages is itself in a rising pattern. This forms a stacked support structure under the price.
- Nearness to Highs: LUV is now priced close to its 52-week high of $45.02. While the wider S&P 500 is also near highs, LUV's ability to match this while keeping such high technical scores confirms its relative performance.
This outstanding technical rating clearly answers the first question for a trader: "Which stock should I buy?" It marks LUV as a technically sound candidate with a good chance of continuing its clear upward trend, making it a fit candidate for more formation study.
Setup Condition: A Pause Giving a Chance
A strong trend by itself is not a signal to buy; entering a stock that has just completed a big, stretched move can be hazardous. This is where the Setup Quality Rating becomes key, answering the trader's second question: "When should I buy it?" LUV scores a 9 out of 10 on this measure, pointing to a very good pause formation inside its forceful uptrend.
The full technical report describes a positive picture. The stock has been moving in a band between about $40.85 and $45.02 over the last month. Lately, it has moved down from the top of this band toward the middle, a shift that can make a more acceptable balance of risk and reward for entry. The report states that "a pullback is taking place, which may present a nice opportunity for an entry."
Important parts of the high-condition setup include:
- Clear Support: A major support area is seen between $42.37 and $42.84, made by a meeting of moving averages and trendlines. This gives a defined level for setting a protective stop-loss order.
- Minimal Resistance Above: With the stock pausing below its recent high, there is observed to be "very little resistance above the current price," indicating a clear route upward if a move higher happens.
- Supportive Movement: A recent "Pocket Pivot" signal, a price increase on greater volume than the worst down volume day in the earlier period, suggests buying may be happening during this pause phase.
A Possible Trade Plan
From this study of technical force and setup condition, the report describes a sample trade plan. It proposes an entry point just above the 10-day moving average at $43.12, with a stop-loss set below the support area at $42.36. This sets a small risk of about 1.77% on the trade. The small stop is a result of the high-condition, narrow pause, which is exactly what the setup rating tries to find. It is very important to note this is an automated example; traders must always change entries, exits, and trade size to match their own risk comfort and plan.
Locating Other Chances
The mix of a full Technical Rating and a very high Setup Rating makes LUV a clear case of what technical screens for moves higher are made to find. For investors wanting to find other stocks now showing this forceful mix of strength and setup, new candidates are found each day. You can see the most recent results by going to the Technical Breakout Setups screen.
Disclaimer: This article is for information only and is not investment advice, a suggestion, or an offer or request to buy or sell any securities. The study is based on technical measures and past data, which are not promises of future results. All trading and investment choices include risk, including the chance of loss of original funds. Readers should do their own study and talk with a qualified financial advisor before making any investment choices.