
For investors looking for a mix of momentum and fundamental quality, a method that joins technical and fundamental study can be a useful instrument. One such tactic looks for stocks showing firm growth traits—good sales and earnings increase, firm profitability, and a steady financial base—while also showing encouraging technical breakout formations. The aim is to find firms where sound business results are starting to be seen by the market, possibly marking the beginning of a new upward price move. This technique tries to match the basic business quality with positive price movement, seeking to take part in moves pushed by both earnings increase and market mood.
LPL Financial Holdings Inc (NASDAQ:LPLA) recently appeared from a scan made to find precisely this mix: firm growth stocks with good technical setup scores. As the country's biggest independent broker-dealer, LPLA offers a combined platform of technology, brokerage, and investment advisory services to financial advisors throughout the U.S. Its business model is tied to the increase of the advisor-mediated wealth management market.
Fundamental Growth Driver
The central attraction of LPLA is found in its clear growth path, which is a main filter in the scanning tactic. A company cannot maintain a technical breakout without the driver of fundamental advance. According to ChartMill's fundamental analysis report, LPLA receives a Growth Rating of 7 out of 10, pointing out its expansion period.
- Recent Performance: The company has shown solid recent growth, with Revenue rising 35.19% over the last year and Earnings Per Share (EPS) increasing by a notable 21.26%.
- Continued Expansion: This is not a single-quarter occurrence. The average yearly EPS increase over recent years is 18.07%, with Revenue increasing at a 17.10% yearly rate, showing a steady execution of its growth plan.
- Future View: Analysts anticipate this momentum to persist, forecasting average yearly Revenue growth of 19.26% and EPS growth of 10.60% in the next years.
This firm growth is backed by what the report labels as "acceptable" profitability and financial soundness, each scoring a 5 and 6 respectively. Important positives involve a very good Return on Equity of 16.52% and a firm Return on Invested Capital of 10.03%, indicating the company is effectively creating profits from its capital. While its valuation is scored as medium, the firm growth measures may support the present earnings multiples, particularly when noting its Price/Earnings ratio is lower than that of the wider S&P 500.
Technical Setup for a Possible Move
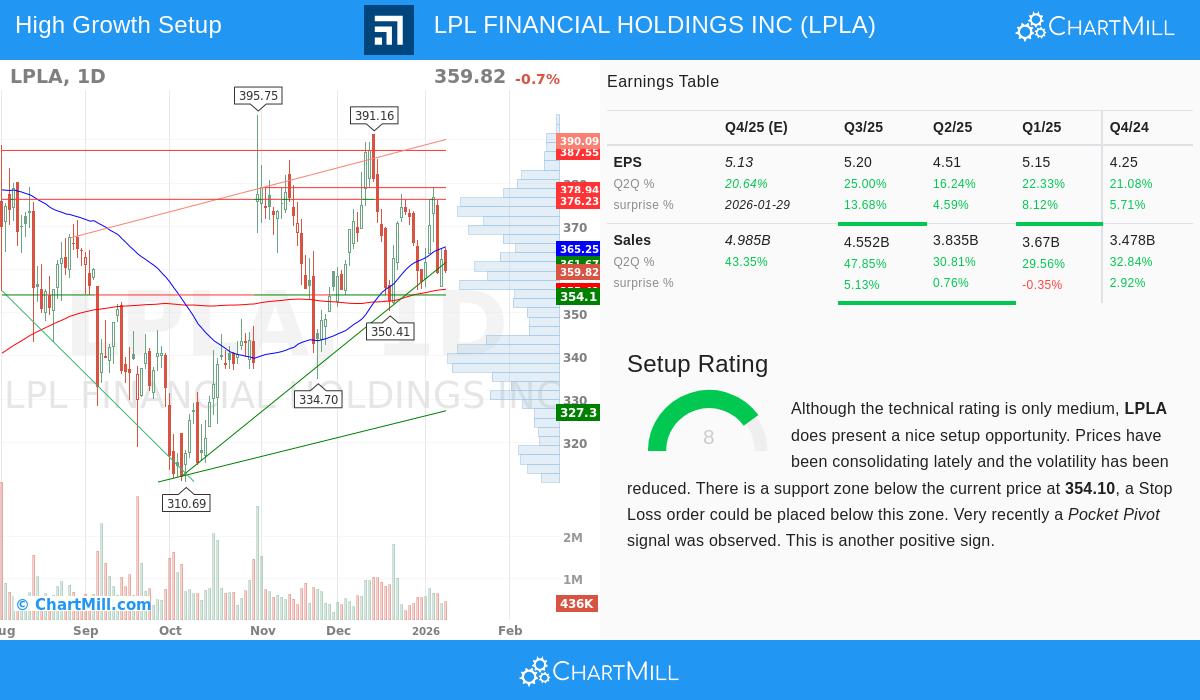
A firm fundamental story requires a technical trigger. The scanning approach favors stocks where this growth is possibly starting to change into price momentum, often after a time of sideways movement. ChartMill's technical analysis report for LPLA mentions a Setup Rating of 8 out of 10, showing a positive pattern may be developing.
- Sideways Movement and Support: The report notes that prices have been moving sideways lately, with price swings reducing—a frequent sign before a notable move. The stock is now trading near the bottom of its recent one-month range, nearing a set support area around $354.10.
- Positive Buying Signal: Importantly, the report points out a recent "Pocket Pivot" signal. This is a volume-based formation that hints at buying, where the price rises on higher volume than the greatest down volume noted in the previous ten days. It can be an early indicator of institutional purchasing interest.
- Trend Background: The longer-term trend for LPLA stays positive, and while the shorter-term trend is neutral, the longer-term trend "is given preference for now." Holding above the noted support levels could give a base for a test of nearby resistance areas.
Why the Mix is Important
The scanning tactic is founded on the idea that these two studies support one another. The fundamental growth standards make sure the company has a real, getting better business to back a maintained price rise—it gives the "reason" for a breakout. The technical setup standards, including formations like the noted sideways movement and Pocket Pivot, try to spot the "timing," giving a tactical entry point that matches a possible return of buying interest. In LPLA's situation, the company's shown and expected high growth meets the fundamental requirement, while the technical view indicates the stock may be tightening for its next move, backed by slight signs of buying.
Locating Comparable Chances
LPL Financial Holdings Inc offers an example in matching firm business growth with a positive technical position. For investors wanting to use this joined fundamental and technical tactic to find other possible candidates, more results can be viewed using the Strong Growth Stock Technical Setups scan.
Disclaimer: This article is for informational purposes only and does not constitute investment advice, a recommendation, or an offer to buy or sell any security. The analysis presented is based on data and reports provided by third parties. Investors should conduct their own independent research and consider their individual financial circumstances before making any investment decisions. Past performance is not indicative of future results.