
For investors looking for a methodical way to find leading companies with high growth, the CANSLIM methodology, created by William O'Neil, remains a foundational strategy. It merges detailed fundamental study with important technical signals to find stocks with solid earnings momentum, support from large investors, and leading traits, best bought when the general market is favorable. This structured system tries to find stocks beginning a significant price increase.
A recent filter using main CANSLIM rules has identified Eli Lilly & Co (NYSE:LLY) as a stock that deserves more study. The large pharmaceutical company seems to match many of the strategy's important parts.
Looking at the Fundamental "CAN SLIM" Rules
A detailed examination of Eli Lilly's financial data shows why it meets the initial fundamental checks of the CANSLIM filter:
-
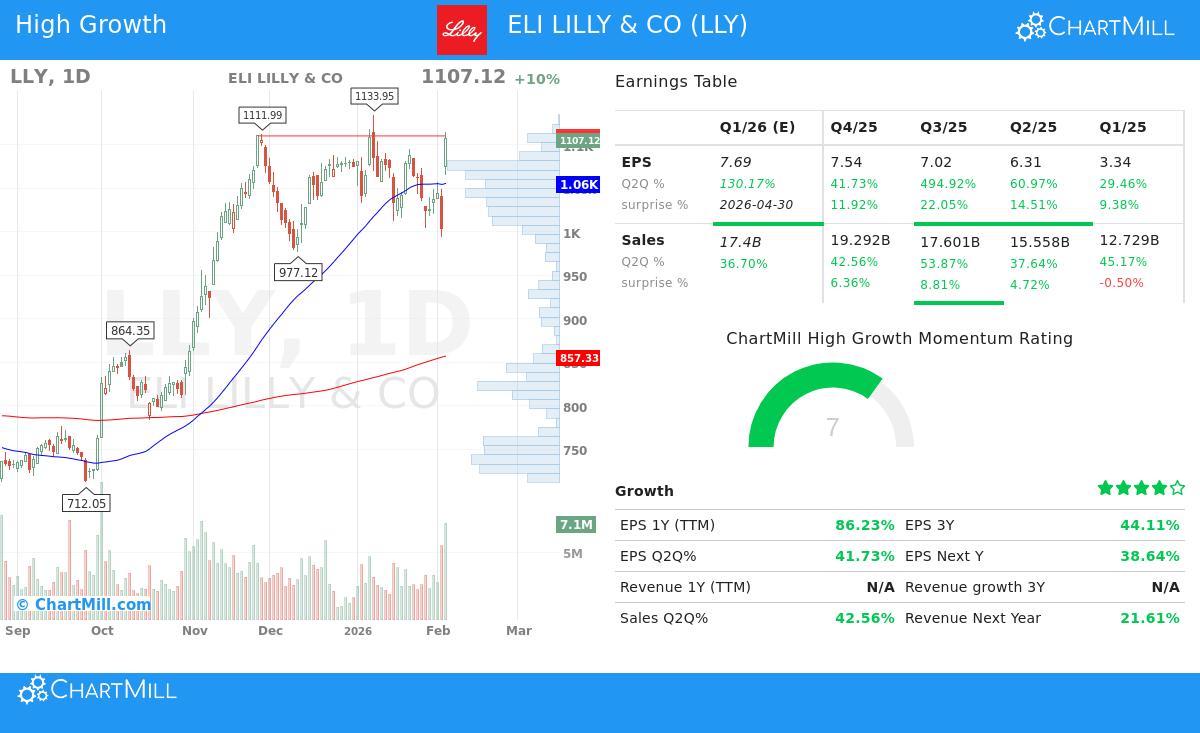
Current Quarterly Earnings & Sales (The "C"): The method requires solid recent momentum. Lilly meets this, with its latest quarterly earnings per share (EPS) rising 41.7% and sales growing 42.6% versus the same quarter last year. These numbers are well above the usual CANSLIM minimums of 20-25%, showing strong current business momentum.
-
Annual Earnings Increases (The "A"): CANSLIM seeks a history of growth, not just one quarter. Lilly shows this with a solid three-year EPS compound annual growth rate (CAGR) of 44.1%. Also, its Return on Equity (ROE) of 77.4% is very high, indicating very efficient use of shareholder money and meeting the system's need for high profitability.
-
Supply & Demand / Financial Health (The "S"): The strategy favors companies with reasonable debt. Lilly's debt-to-equity ratio of 1.72 is lower than the filter's limit of 2, showing a balance sheet that, while using debt, is within an acceptable area for a big, cash-producing business.
-
Institutional Sponsorship (The "I"): CANSLIM investors like to see professional investor interest but avoid stocks that are owned too heavily. Lilly's institutional ownership of 83.1% indicates good support from funds and big investors while still allowing for more buying, a favorable point under the method.
Leadership and Market Position
Beyond the raw figures, two other letters in the name are key for context.
-
Leader or Laggard (The "L"): A central idea of CANSLIM is to buy market leaders. This is measured with relative strength (RS), which compares a stock's price action to the wider market. Lilly has a high RS rating of 82.5, meaning it has done better than about 83% of all stocks. This leading quality is important, as the method states that stocks with solid fundamentals are frequently noticed and their prices increased by the market first.
-
Market Direction (The "M"): Regardless of how good a single stock is, CANSLIM suggests making investments that match the general market direction. At this time, the S&P 500 shows a favorable short-term direction, which creates a better setting for growth stocks like Lilly to do well, following the strategy's guidelines.
Summary of Technical and Fundamental Data
The given reports present a combined picture of Lilly's position. The fundamental analysis report gives LLY a score of 6 out of 10, noting its "excellent profitability" from very good margins and returns on capital. It mentions solid historical and projected future growth, although it states the present price is high based on standard price-to-earnings measures. The condition of its balance sheet gets an average score, with some comments on cash availability and debt.
On the technical side, the technical analysis report gives LLY a score of 7 out of 10. It confirms the stock's leading position, trading close to its 52-week high with a good long-term direction. The report states the stock has been moving in a broad range lately and suggests that while the technical score is high, the best moment for a new purchase might need waiting for a clearer price pattern.
A Stock for More Study
Based on the used CANSLIM filters, Eli Lilly & Co shows a notable profile for investors focused on growth. It displays the strong earnings growth, high profitability, market leadership, and institutional interest the strategy looks for. While its high price deserves notice and the technical buying point may not be perfect for everyone, it represents the kind of strong company in a leading field that CANSLIM is designed to find.
For investors wanting to find other companies that currently fit similar CANSLIM-based rules, you can view the complete filter results via this link.
Disclaimer: This article is for information and learning only and is not investment advice, a suggestion, or an offer to buy or sell any security. The CANSLIM methodology is a model framework, and not all rules may be fully measurable or relevant in all market settings. Investors must do their own complete research, thinking about their personal financial position and risk comfort, before making any investment choices. Past results do not guarantee future outcomes.