
Our stock screening tool has pinpointed LI AUTO INC - ADR (NASDAQ:LI) as an undervalued stock. LI maintains a solid financial footing. Furthermore, it remains attractively priced. Let's delve into the specifics below.
Assessing Valuation for LI
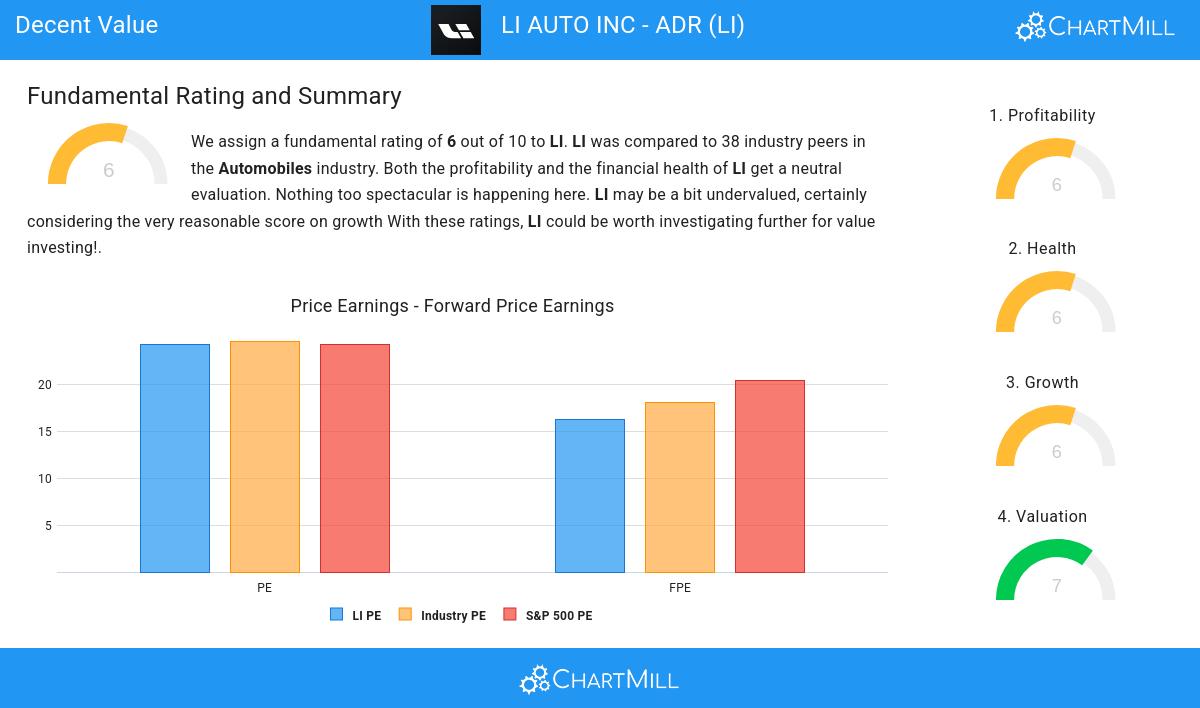
ChartMill assigns a proprietary Valuation Rating to each stock. The score is computed by evaluating various valuation aspects, like price to earnings and free cash flow, both absolutely as relative to the market and industry. LI was assigned a score of 7 for valuation:
- Based on the Price/Earnings ratio, LI is valued a bit cheaper than 76.32% of the companies in the same industry.
- Based on the Price/Forward Earnings ratio, LI is valued a bit cheaper than the industry average as 76.32% of the companies are valued more expensively.
- When comparing the Price/Forward Earnings ratio of LI to the average of the S&P500 Index (20.44), we can say LI is valued slightly cheaper.
- Based on the Enterprise Value to EBITDA ratio, LI is valued cheaply inside the industry as 94.74% of the companies are valued more expensively.
- Based on the Price/Free Cash Flow ratio, LI is valued cheaply inside the industry as 86.84% of the companies are valued more expensively.
- LI's low PEG Ratio(NY), which compensates the Price/Earnings for growth, indicates a rather cheap valuation of the company.
- LI has a very decent profitability rating, which may justify a higher PE ratio.
- A more expensive valuation may be justified as LI's earnings are expected to grow with 41.76% in the coming years.
Evaluating Profitability: LI
ChartMill assigns a Profitability Rating to every stock. This score ranges from 0 to 10 and evaluates the different profitability ratios and margins, both absolutely, but also relative to the industry peers. LI scores a 6 out of 10:
- Looking at the Return On Assets, with a value of 4.95%, LI belongs to the top of the industry, outperforming 89.47% of the companies in the same industry.
- LI's Return On Equity of 11.33% is amongst the best of the industry. LI outperforms 89.47% of its industry peers.
- The Return On Invested Capital of LI (5.68%) is better than 86.84% of its industry peers.
- With an excellent Profit Margin value of 5.56%, LI belongs to the best of the industry, outperforming 89.47% of the companies in the same industry.
- With an excellent Operating Margin value of 4.86%, LI belongs to the best of the industry, outperforming 81.58% of the companies in the same industry.
- With a decent Gross Margin value of 20.53%, LI is doing good in the industry, outperforming 78.95% of the companies in the same industry.
Health Assessment of LI
Every stock is evaluated by ChartMill, receiving a Health Rating on a scale of 0 to 10. This assessment considers different health aspects, including liquidity and solvency, both in absolute terms and relative to industry peers. LI has achieved a 6 out of 10:
- With an excellent Altman-Z score value of 2.83, LI belongs to the best of the industry, outperforming 86.84% of the companies in the same industry.
- The Debt to FCF ratio of LI is 2.77, which is a good value as it means it would take LI, 2.77 years of fcf income to pay off all of its debts.
- LI's Debt to FCF ratio of 2.77 is amongst the best of the industry. LI outperforms 92.11% of its industry peers.
- A Debt/Equity ratio of 0.32 indicates that LI is not too dependend on debt financing.
- With a decent Debt to Equity ratio value of 0.32, LI is doing good in the industry, outperforming 68.42% of the companies in the same industry.
- Looking at the Current ratio, with a value of 1.82, LI is in the better half of the industry, outperforming 76.32% of the companies in the same industry.
- LI has a Quick ratio of 1.71. This is amongst the best in the industry. LI outperforms 84.21% of its industry peers.
A Closer Look at Growth for LI
ChartMill assigns a Growth Rating to every stock. This score ranges from 0 to 10 and evaluates the different growth aspects like EPS and Revenue, both in the past as in the future. LI scores a 6 out of 10:
- The Revenue has grown by 16.64% in the past year. This is quite good.
- The Revenue has been growing by 247.68% on average over the past years. This is a very strong growth!
- LI is expected to show a strong growth in Earnings Per Share. In the coming years, the EPS will grow by 23.09% yearly.
- The Revenue is expected to grow by 15.91% on average over the next years. This is quite good.
Our Decent Value screener lists more Decent Value stocks and is updated daily.
For an up to date full fundamental analysis you can check the fundamental report of LI
Disclaimer
This is not investing advice! The article highlights some of the observations at the time of writing, but you should always make your own analysis and invest based on your own insights.