
LI AUTO INC - ADR (NASDAQ:LI) was identified as an affordable growth stock by our stock screener. LI is showing great growth, but also scores well on profitability, solvency and liquidity. At the same time it seems to be priced reasonably. We'll explore this a bit deeper below.
Growth Examination for LI
ChartMill assigns a proprietary Growth Rating to each stock. The score is computed by evaluating various growth aspects, like EPS and revenue growth. We take into account the history as well as the estimated future numbers. LI was assigned a score of 8 for growth:
- The Earnings Per Share has grown by an impressive 59.14% over the past year.
- LI shows a strong growth in Revenue. In the last year, the Revenue has grown by 42.25%.
- The Revenue has been growing by 135.72% on average over the past years. This is a very strong growth!
- LI is expected to show quite a strong growth in Earnings Per Share. In the coming years, the EPS will grow by 8.56% yearly.
- Based on estimates for the next years, LI will show a very strong growth in Revenue. The Revenue will grow by 20.25% on average per year.
What does the Valuation looks like for LI
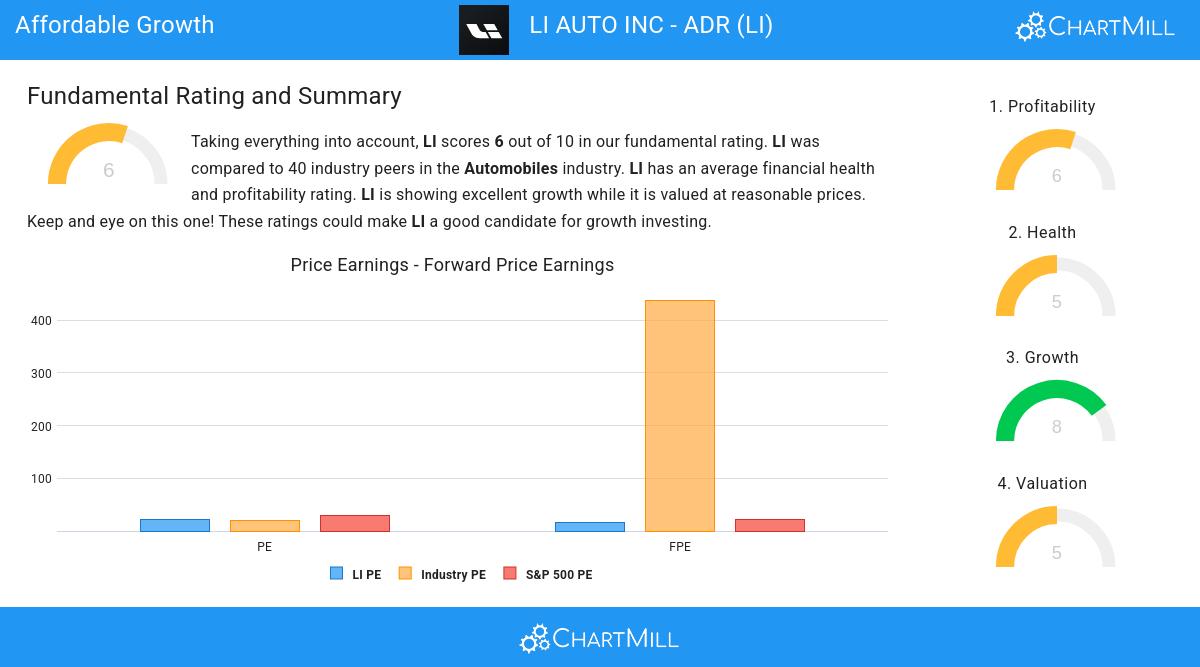
ChartMill assigns a Valuation Rating to every stock. This score ranges from 0 to 10 and evaluates the different valuation aspects and compares the price to earnings and cash flows, while taking into account profitability and growth. LI scores a 5 out of 10:
- LI's Price/Earnings ratio is a bit cheaper when compared to the industry. LI is cheaper than 75.00% of the companies in the same industry.
- LI is valuated rather cheaply when we compare the Price/Earnings ratio to 28.64, which is the current average of the S&P500 Index.
- LI's Price/Forward Earnings ratio is a bit cheaper when compared to the industry. LI is cheaper than 77.50% of the companies in the same industry.
- LI is valuated rather cheaply when we compare the Price/Forward Earnings ratio to 21.42, which is the current average of the S&P500 Index.
- Based on the Enterprise Value to EBITDA ratio, LI is valued a bit cheaper than 77.50% of the companies in the same industry.
- LI's Price/Free Cash Flow ratio is rather cheap when compared to the industry. LI is cheaper than 92.50% of the companies in the same industry.
- LI has a very decent profitability rating, which may justify a higher PE ratio.
- A more expensive valuation may be justified as LI's earnings are expected to grow with 19.79% in the coming years.
How We Gauge Health for LI
ChartMill assigns a Health Rating to every stock. This score ranges from 0 to 10 and evaluates the different health aspects like liquidity and solvency, both absolutely, but also relative to the industry peers. LI scores a 5 out of 10:
- The Debt to FCF ratio of LI is 0.39, which is an excellent value as it means it would take LI, only 0.39 years of fcf income to pay off all of its debts.
- Looking at the Debt to FCF ratio, with a value of 0.39, LI belongs to the top of the industry, outperforming 100.00% of the companies in the same industry.
- A Debt/Equity ratio of 0.13 indicates that LI is not too dependend on debt financing.
- With a decent Debt to Equity ratio value of 0.13, LI is doing good in the industry, outperforming 80.00% of the companies in the same industry.
- The Current ratio of LI (1.76) is better than 67.50% of its industry peers.
- The Quick ratio of LI (1.64) is better than 80.00% of its industry peers.
Profitability Insights: LI
ChartMill assigns a proprietary Profitability Rating to each stock. The score is computed by evaluating various profitability ratios and margins and ranges from 0 to 10. LI was assigned a score of 6 for profitability:
- Looking at the Return On Assets, with a value of 6.57%, LI belongs to the top of the industry, outperforming 95.00% of the companies in the same industry.
- The Return On Equity of LI (15.27%) is better than 92.50% of its industry peers.
- Looking at the Return On Invested Capital, with a value of 5.78%, LI belongs to the top of the industry, outperforming 85.00% of the companies in the same industry.
- With an excellent Profit Margin value of 7.16%, LI belongs to the best of the industry, outperforming 85.00% of the companies in the same industry.
- With a decent Operating Margin value of 4.48%, LI is doing good in the industry, outperforming 80.00% of the companies in the same industry.
- LI has a Gross Margin of 21.47%. This is amongst the best in the industry. LI outperforms 82.50% of its industry peers.
- In the last couple of years the Gross Margin of LI has grown nicely.
More Affordable Growth stocks can be found in our Affordable Growth screener.
Our latest full fundamental report of LI contains the most current fundamental analsysis.
Disclaimer
This is not investing advice! The article highlights some of the observations at the time of writing, but you should always make your own analysis and invest based on your own insights.
