
For investors who use charts and price action to make decisions, the idea of a "technical breakout" is a fundamental strategy. The aim is to find stocks that are in a solid, confirmed uptrend and are also taking a pause to build on their gains. This pause, frequently seen with lower volatility and price action inside a tight band, creates the conditions for the next possible upward move. By joining a measure of a stock's general technical condition with a number that details the strength of its present pause pattern, traders can methodically search for these high-likelihood situations. One approach uses ChartMill's own Technical Rating and Setup Quality Rating to sort the market for interesting possibilities.
A recent search using this approach has pointed to L3HARRIS TECHNOLOGIES INC (NYSE:LHX) as a stock displaying an interesting technical picture. The defense and aerospace contractor seems to be creating a standard breakout pattern, joining solid fundamental strength with a clear entry chance.
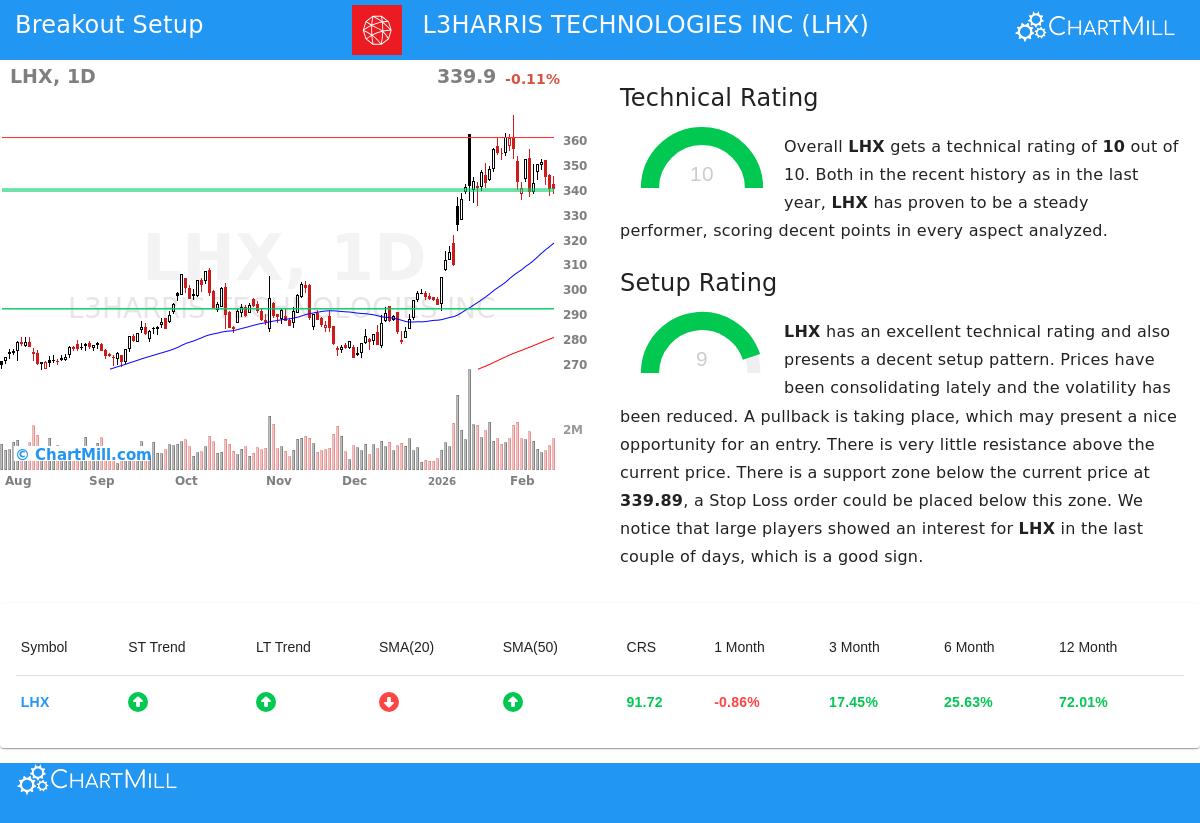
Looking at the Technical Base
The first part of this strategy is confirming the stock is in a definite uptrend, which is exactly what the ChartMill Technical Rating measures. A high number points to good momentum and sound price formation across various time periods. L3Harris does very well here, receiving a top rating of 10 out of 10. This leading number is made from a few important technical parts:
- Positive Trend Agreement: Both the near-term and longer-term trends for LHX are scored as positive. This agreement is a strong sign, pointing to continued buying interest and an absence of major selling.
- Good Relative Performance: The stock's performance over the year puts it in the top 9% of the whole market, showing clear outperformance. This relative performance is a sign of market strength.
- Helpful Moving Averages: The stock's price is above its important moving averages (50-day, 100-day, and 200-day), and these averages are themselves in upward arrangements. This "ordered" moving average arrangement is a standard feature of a sound bull market.
This outstanding technical rating addresses the important question of which stock to examine. It verifies that LHX is not a short-lived rebound but a stock with proven, high-quality momentum. You can see the complete technical details in the ChartMill Technical Analysis report for LHX.
Judging the Setup Strength
A solid trend by itself is not a signal to buy; entering after a fast, long rise has notable risk. This is where the Setup Quality Rating is key, dealing with the question of when to think about an entry. It searches for times of pause or rest inside the larger uptrend. L3Harris gets a 9 out of 10 here, meaning a strong setup is present.
The analysis states that prices have been pausing recently with less volatility, and specifically points out a "bull flag" formation. This formation happens when a stock moves down slightly in a controlled way after a good rise, often making a small downward channel that looks like a flag on a pole. The report points to a few helpful elements for the setup:
- Defined Support Area: A clear support zone has been formed between $339.06 and $339.89, made by a combination of trendlines. This gives a sensible point for setting a protective stop-loss order.
- Limited Decline: The present price action is called a decline that is staying above support, not a fall. This action is common before the earlier trend continues.
- Large Trader Activity: The report states that big traders have shown activity in LHX in recent days, as shown by volume study, which can come before more buying.
The pairing of a top Technical Rating (10) and a very high Setup Rating (9) forms the main idea for a technical breakout idea. It indicates LHX is a strong stock that has paused to rest after a good run and could be getting ready for its next upward move.
Trade Plan and Risk Control
From this analysis, a sample trading plan is given. It proposes a possible entry point just above the present level, near $344.16, with a stop-loss order set below the noted support zone around $339.05. This plan would cap the theoretical maximum loss on the trade to about 1.5%. It is important to know this is a sample made from the technical formations. Any trading choice must include an investor's own risk comfort, position size plan, and fundamental study, especially before possible events like earnings reports.
The method that found LHX is used each day to the wider market. For investors wanting to see other stocks that now fit these strict technical and setup rules, the current results can be found on the Technical Breakout Setups screen.
Disclaimer: This article is for information and example only and is not meant as investment guidance. The study is based on technical measures and automated scanning. The given trade sample is not a suggestion. Investing in securities has risk, including the possible loss of principal. Always do your own complete research, think about your financial position and risk comfort, and talk with a qualified financial advisor before making any investment choices.