
Uncover the hidden value in LAZARD INC (NYSE:LAZ) as our stock screening tool recommends it as an undervalued choice. NYSE:LAZ maintains a robust financial position and offers an attractive pricing perspective. Let's dig deeper into the analysis.
Valuation Analysis for NYSE:LAZ
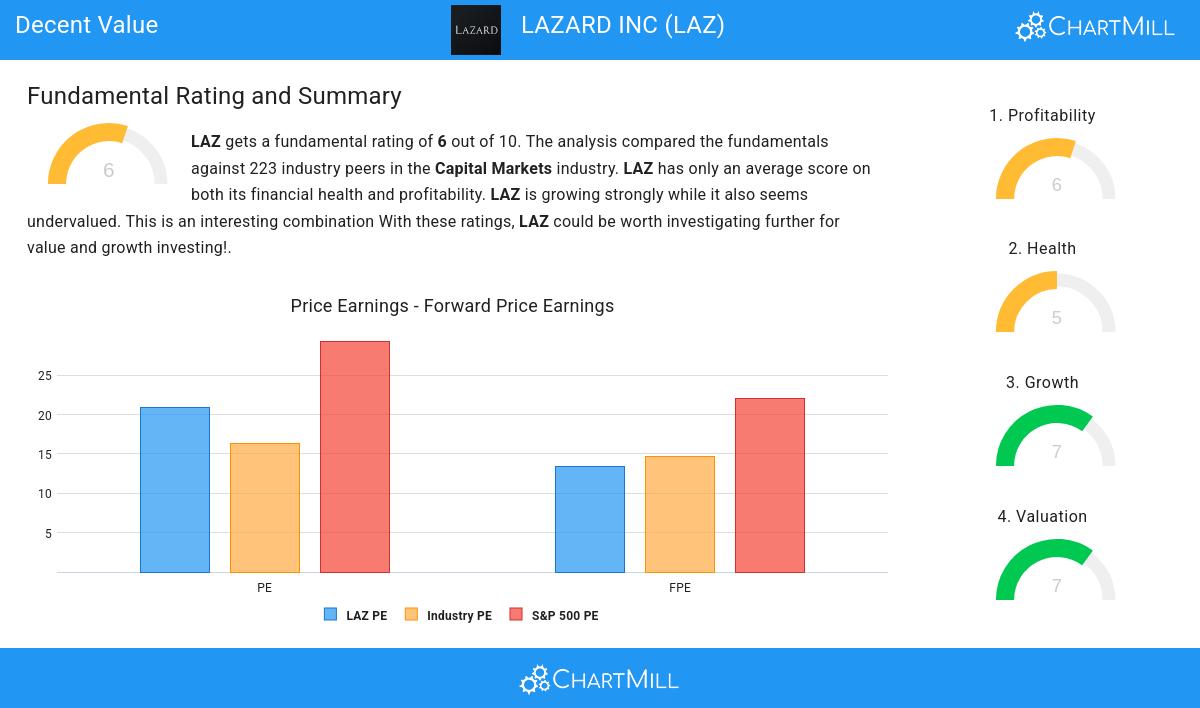
To assess a stock's valuation, ChartMill utilizes a Valuation Rating on a scale of 0 to 10. This comprehensive assessment considers various valuation aspects, comparing price to earnings and cash flows, while factoring in profitability and growth. NYSE:LAZ has achieved a 7 out of 10:
- LAZ's Price/Earnings ratio indicates a valuation a bit cheaper than the S&P500 average which is at 29.35.
- The average S&P500 Price/Forward Earnings ratio is at 22.10. LAZ is valued slightly cheaper when compared to this.
- Based on the Enterprise Value to EBITDA ratio, LAZ is valued cheaply inside the industry as 82.96% of the companies are valued more expensively.
- 80.72% of the companies in the same industry are more expensive than LAZ, based on the Price/Free Cash Flow ratio.
- The low PEG Ratio(NY), which compensates the Price/Earnings for growth, indicates a rather cheap valuation of the company.
- LAZ has a very decent profitability rating, which may justify a higher PE ratio.
- LAZ's earnings are expected to grow with 31.51% in the coming years. This may justify a more expensive valuation.
Understanding NYSE:LAZ's Profitability
Discover ChartMill's exclusive Profitability Rating, a proprietary metric that assesses stocks on a scale of 0 to 10. It takes into consideration various profitability ratios and margins, both in absolute terms and relative to industry peers. Notably, NYSE:LAZ has achieved a 6:
- The Return On Assets of LAZ (5.70%) is better than 70.40% of its industry peers.
- With an excellent Return On Equity value of 42.91%, LAZ belongs to the best of the industry, outperforming 97.76% of the companies in the same industry.
- LAZ has a better Return On Invested Capital (10.37%) than 84.30% of its industry peers.
- The last Return On Invested Capital (10.37%) for LAZ is above the 3 year average (6.49%), which is a sign of increasing profitability.
- Looking at the Gross Margin, with a value of 93.82%, LAZ belongs to the top of the industry, outperforming 93.72% of the companies in the same industry.
A Closer Look at Health for NYSE:LAZ
ChartMill assigns a Health Rating to every stock. This score ranges from 0 to 10 and evaluates the different health aspects like liquidity and solvency, both absolutely, but also relative to the industry peers. NYSE:LAZ scores a 5 out of 10:
- LAZ's Altman-Z score of 2.36 is fine compared to the rest of the industry. LAZ outperforms 74.89% of its industry peers.
- LAZ has a debt to FCF ratio of 2.98. This is a good value and a sign of high solvency as LAZ would need 2.98 years to pay back of all of its debts.
- Looking at the Debt to FCF ratio, with a value of 2.98, LAZ is in the better half of the industry, outperforming 75.34% of the companies in the same industry.
How do we evaluate the Growth for NYSE:LAZ?
ChartMill assigns a Growth Rating to each stock, ranging from 0 to 10. This rating is determined by analyzing different growth elements, including EPS and revenue growth, spanning both historical and future figures. In the case of NYSE:LAZ, the assigned 7 reflects its growth potential:
- LAZ shows a strong growth in Earnings Per Share. In the last year, the EPS has been growing by 216.22%, which is quite impressive.
- Looking at the last year, LAZ shows a very strong growth in Revenue. The Revenue has grown by 20.94%.
- Based on estimates for the next years, LAZ will show a very strong growth in Earnings Per Share. The EPS will grow by 31.51% on average per year.
- Based on estimates for the next years, LAZ will show a quite strong growth in Revenue. The Revenue will grow by 10.71% on average per year.
- The EPS growth rate is accelerating: in the next years the growth will be better than in the last years.
- The Revenue growth rate is accelerating: in the next years the growth will be better than in the last years.
More Decent Value stocks can be found in our Decent Value screener.
Our latest full fundamental report of LAZ contains the most current fundamental analsysis.
Disclaimer
This article should in no way be interpreted as advice. The article is based on the observed metrics at the time of writing, but you should always make your own analysis and trade or invest at your own responsibility.