
Our stock screener has spotted KROGER CO (NYSE:KR) as a possible breakout candidate. A technical breakout setup pattern occurs when the stock is consolidating after a nice uptrend. Whether the actual breakout occurs remains to be seen of course, but it may be interesting to keep an eye on NYSE:KR.
Deciphering the Technical Picture of KR
ChartMill assigns a Technical Rating to every stock. This score ranges from 0 to 10 and is updated daily. The score is determined by evaluating multiple technical indicators and properties.
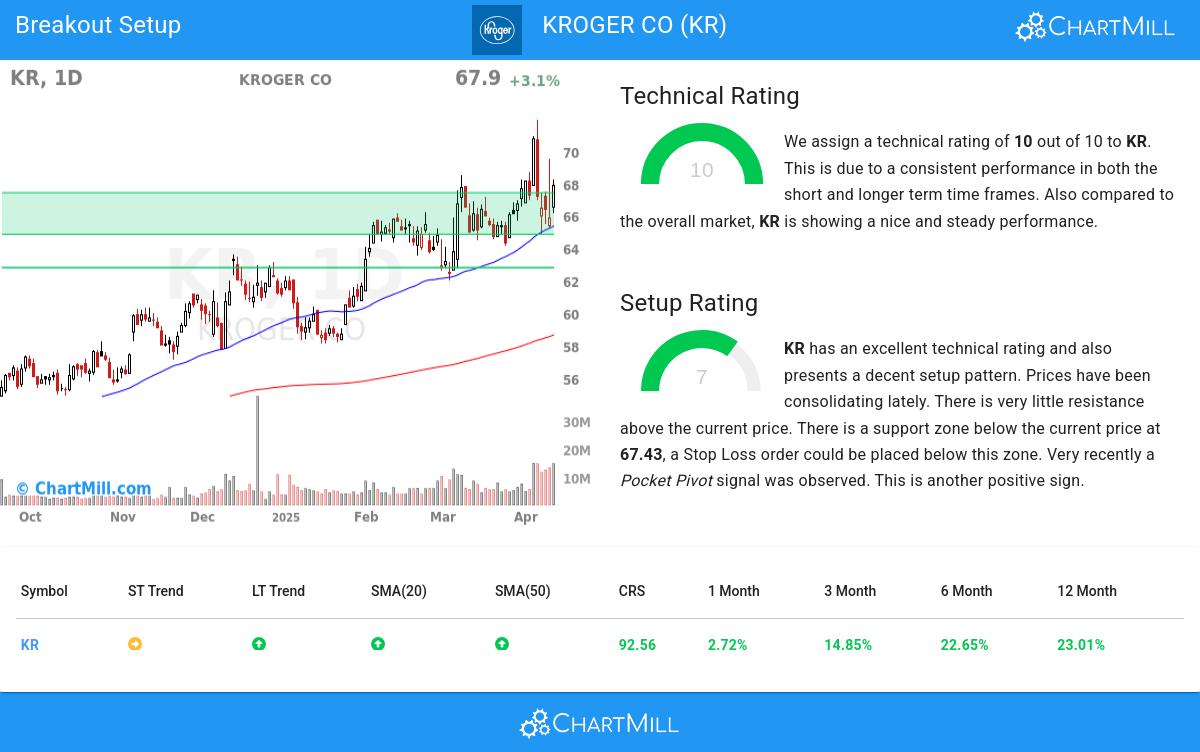
Overall KR gets a technical rating of 10 out of 10. This is due to a consistent performance in both the short and longer term time frames. Also compared to the overall market, KR is showing a nice and steady performance.
- The short term is neutral, but the long term trend is still positive. Not much to worry about for now.
- When comparing the yearly performance of all stocks, we notice that KR is one of the better performing stocks in the market, outperforming 92% of all stocks. On top of that, KR also shows a nice and consistent pattern of rising prices.
- KR is currently trading in the upper part of its 52 week range. The market is still in the middle of its 52 week range, so KR slightly outperforms the market at the moment.
- KR is an average performer in the Consumer Staples Distribution & Retail industry, it outperforms 64% of 40 stocks in the same industry.
- In the last month KR has a been trading in the 64.18 - 71.93 range, which is quite wide. It is currently trading in the middle of this range, so some resistance may be found above.
- Volume is considerably higher in the last couple of days.
Our latest full technical report of KR contains the most current technical analsysis.
How do we evaluate the setup for KR?
Next to the Technical Rating, the Setup Rating of a stock determines to which extend the stock is consolidating. This score also ranges from 0 to 10 and is updated daily. The setup score evaluates various short term technical indicators. For KR this score is currently 7:
Besides having an excellent technical rating, KR also presents a decent setup pattern. Prices have been consolidating lately. There is very little resistance above the current price. There is a support zone below the current price at 67.43, a Stop Loss order could be placed below this zone. Another positive sign is the recent Pocket Pivot signal.
How can KR be traded?
One way to play this would be to wait for the actual breakout to happen and buy when the stock breaks out above the current consolidation zone. A possible place for a stop loss would be below this zone.
Please note that this article should not be construed as trading advice. The information provided is solely based on automated technical analysis and serves to highlight technical observations. It is important to conduct your own analysis and make trading decisions based on your own judgment and responsibility.
More breakout setups can be found in our Breakout screener.
Keep in mind
This article should in no way be interpreted as advice. The article is based on the observed metrics at the time of writing, but you should always make your own analysis and trade or invest at your own responsibility.