
Our stock screener has spotted KEURIG DR PEPPER INC (NASDAQ:KDP) as a possible breakout candidate. A technical breakout setup pattern occurs when the stock is consolidating after a nice uptrend. Whether the actual breakout occurs remains to be seen of course, but it may be interesting to keep an eye on NASDAQ:KDP.
Zooming in on the technicals.
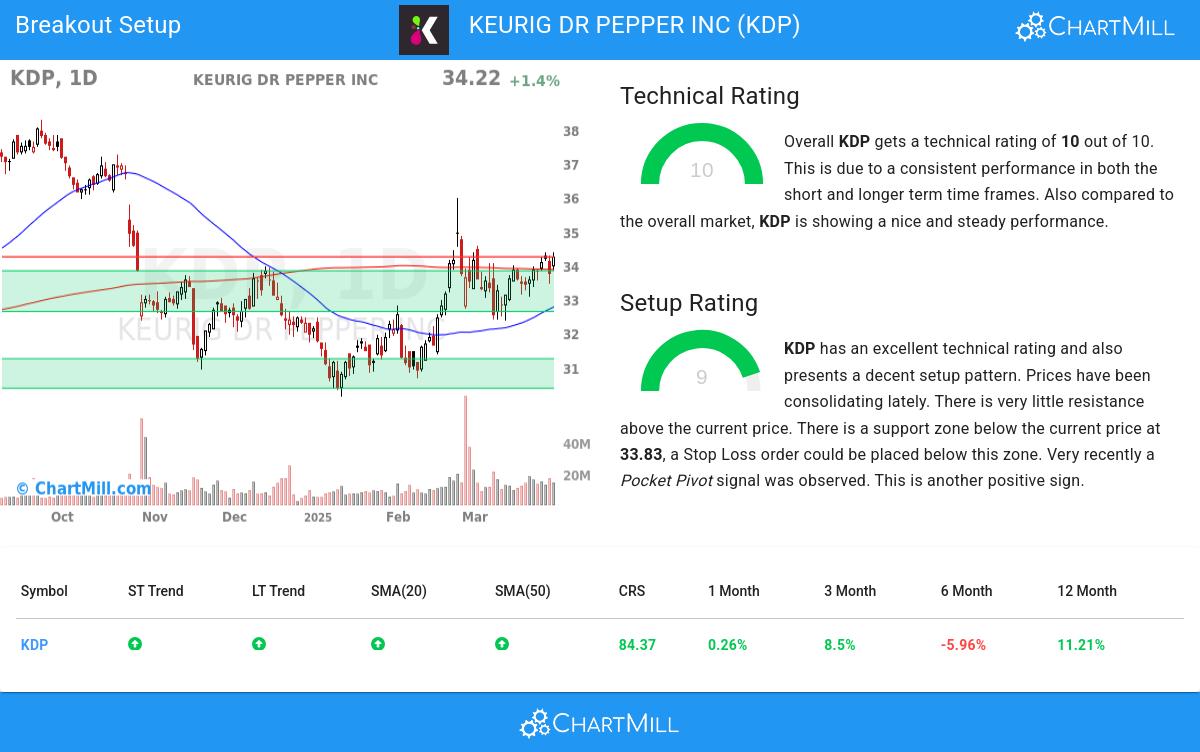
ChartMill utilizes a proprietary algorithm to assign a Technical Rating to every stock. This rating, ranging from 0 to 10, is computed daily by analyzing a variety of technical indicators and properties.
We assign a technical rating of 10 out of 10 to KDP. Both in the recent history as in the last year, KDP has proven to be a steady performer, scoring decent points in every aspect analyzed.
- Both the short term and long term trends are positive. This is a very positive sign.
- Looking at the yearly performance, KDP did better than 84% of all other stocks.
- In the last month KDP has a been trading in the 32.36 - 34.58 range, which is quite wide. It is currently trading near the high of this range.
- Prices have been consolidating recently, this may present a good entry opportunity.
- KDP is an average performer in the Beverages industry, it outperforms 60% of 31 stocks in the same industry.
- KDP is currently trading in the middle of its 52 week range. This is in line with the S&P500 Index, which is also trading in the middle of its range.
Check the latest full technical report of KDP for a complete technical analysis.
How does the Setup look for KDP
Next to the Technical Rating, the Setup Rating of a stock determines to which extend the stock is consolidating. This score also ranges from 0 to 10 and is updated daily. The setup score evaluates various short term technical indicators. For KDP this score is currently 9:
KDP has an excellent technical rating and also presents a decent setup pattern. Prices have been consolidating lately. There is very little resistance above the current price. There is a support zone below the current price at 33.83, a Stop Loss order could be placed below this zone. Very recently a Pocket Pivot signal was observed. This is another positive sign.
Trading breakout setups.
One strategy to consider is waiting for the actual breakout to occur, where the stock breaks out above the current consolidation zone. Traders can then enter a buy position, anticipating further upward momentum. As a risk management measure, it is advisable to set a stop loss order below the consolidation zone.
Disclaimer: This article is not intended to provide trading advice. It is crucial to conduct your own analysis and consider your own observations and trading style when making investment decisions. The article solely presents technical observations and should not be relied upon as a sole basis for trading.
Our Breakout screener lists more breakout setups and is updated daily.
Disclaimer
This article should in no way be interpreted as advice. The article is based on the observed metrics at the time of writing, but you should always make your own analysis and trade or invest at your own responsibility.