
The process of identifying stocks with the potential for major growth often involves combining strict technical analysis with a focus on fundamental momentum. One organized approach to this is the strategy made famous by trader Mark Minervini, which highlights finding stocks in strong uptrends that are also backed by quickening business fundamentals. This method uses a specific "Trend Template" to filter for technically sound setups and adds criteria for high growth momentum, looking for companies that are not just rising but doing so because of solid and getting better financial performance.
The St. Joe Co. (NYSE:JOE) recently appeared through a screen made to find such opportunities. The screen uses Minervini's Trend Template to confirm a stock is in a clear, long-term uptrend, and then adds a "High Growth Momentum" rating to filter for companies showing solid fundamental acceleration. A detailed examination of JOE shows why it met both groups of criteria.
Meeting the Minervini Trend Template
Minervini's Trend Template is a list of technical conditions made to find stocks in a leading Stage 2 uptrend, where most of a stock's major price gains usually happen. For a stock to pass, it must show agreement across several moving averages and demonstrate clear price strength compared to its past range. The St. Joe Company currently meets these important conditions:
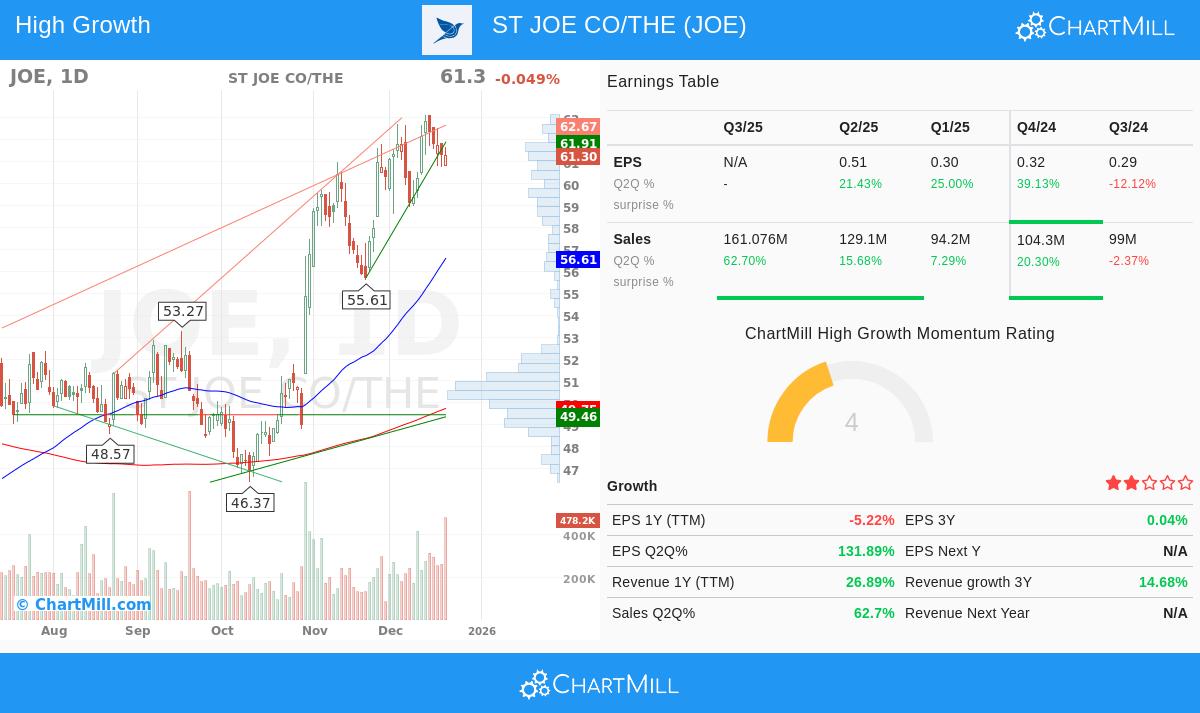
- Price Above Key Averages: JOE's current price is trading well above its rising 50-day ($56.61), 150-day ($51.51), and 200-day ($49.75) simple moving averages. This layered agreement is a standard sign of continued bullish momentum across all timeframes.
- Moving Average Agreement: The shorter-term 50-day moving average is above both the 150-day and 200-day averages, while the 150-day is also above the 200-day. This sequence confirms the strength and steadiness of the uptrend.
- Nearness to Highs: A main idea of the strategy is to focus on strength, not weakness. JOE's price is within 3% of its 52-week high of $63.13, showing it is acting as a market leader instead of falling behind. At the same time, the stock is trading more than 50% above its 52-week low, confirming a major recovery and set uptrend.
- Superior Relative Strength: The stock has a ChartMill Relative Strength (CRS) rating of 88.28, meaning it is doing better than nearly 90% of the whole market. Minervini states that real market leaders regularly show high relative strength, as it points to institutional demand and money moving into the stock.
This technical view shows JOE as a stock in a strong, set uptrend with clear leadership traits, exactly the type of setup the Trend Template is made to find.
Fundamentals Supporting High Growth Momentum
While the Trend Template finds the "how" of a stock's price movement, the "why" often exists in its fundamental performance. The High Growth Momentum filter looks for companies where business fundamentals are not just solid, but quickening. JOE's recent financial numbers point to this kind of operational momentum, which can act as the reason for continued price gains.
- Major Quarterly Earnings Growth: The most recent quarter showed a year-over-year earnings per share (EPS) increase of about 132%. This comes after solid past quarters with growth of 21%, 26%, and 43%. This sequence of major and quickening quarterly EPS growth is a key trait of companies going through a fundamental change point.
- Solid Revenue Growth: Top-line growth is also notable, with sales in the last quarter rising over 62% compared to the same time last year. This shows the company is successfully growing its operations and meeting market demand.
- Strong Cash Flow Creation: The company's trailing twelve-month free cash flow per share is $2.95, showing a year-over-year increase of over 67%. Growing free cash flow gives financial room for more investment, debt lowering, or shareholder returns.
- Good and Growing Profitability: The profit margin in the last reported quarter was 24%, showing growth over the previous quarter's 22.9%. A trend of growing margins points to better operational efficiency and pricing ability as the business expands.
These fundamental items give a clear reason for the stock's technical strength. In the Minervini system, such quickening earnings and sales growth often draw institutional investors, creating the continued buying that drives strong uptrends.
Technical Health and Setup Summary
Beyond the specific Trend Template criteria, JOE's overall technical health is solid. ChartMill's own Technical Rating gives the stock a full score of 10 out of 10, showing very good strength in both short and long-term trends. The related Setup Rating is 7, showing the stock is settling in a fairly tight range near its highs, a pattern that may come before a new upward move. The technical analysis report notes a forming bull flag pattern and finds clear support and resistance levels, giving a structure for judging possible entry and exit points. A detailed look at the technical picture is in the full ChartMill technical report for JOE.
A Candidate for Further Analysis
The combination of a perfect Minervini Trend Template setup and notable high-growth fundamental numbers makes The St. Joe Company a significant candidate for investors using a growth-and-momentum method. It shows the strategy's main idea: finding leaders that are strong because their core business is getting stronger. Of course, this analysis is a beginning for more detailed research, not a suggestion.
For investors looking to find similar opportunities, the screen that found JOE is open to the public. You can view the current results of the High Growth Momentum + Trend Template screen on ChartMill.
Disclaimer: This article is for informational and educational purposes only. It is not intended as investment advice, a recommendation, or an offer to buy or sell any security. The analysis is based on data and methods thought to be reliable, but no guarantee is made as to its accuracy or completeness. Investors should do their own research and talk with a qualified financial advisor before making any investment decisions. Past performance is not a guide to future results.