
In the search for high-growth investment opportunities, combining strict technical study with fundamental momentum can be a useful method. One way that shows this is the strategy made known by trader Mark Minervini, which uses a defined Trend Template to find stocks in clear, strong uptrends. This technical base is then combined with a look at companies showing solid and quickening fundamental growth, a key feature of high-growth momentum investing. The aim is to find leading stocks early in their big price advances, where the combination of a good chart and solid business results makes a positive risk/reward situation.
Incyte Corp (NASDAQ:INCY) comes forward as a present candidate that seems to fit the main rules of this combined method. As a biopharmaceutical company centered on proprietary therapeutics in oncology and inflammation, its recent price movement and fundamental numbers justify a more detailed examination through this view.
Looking at the Technical Trend: The Minervini Template
The Minervini Trend Template gives a fixed, rules-based system to make sure a stock is in a clear uptrend before review. It removes weaker charts, centering only on those showing better relative strength and organized price formation. A check of Incyte's main numbers shows it currently meets the primary technical list:
- Price vs. Moving Averages: The present price trades above the rising 50-day, 150-day, and 200-day simple moving averages (SMAs). This layered order shows continued buying interest across several time periods.
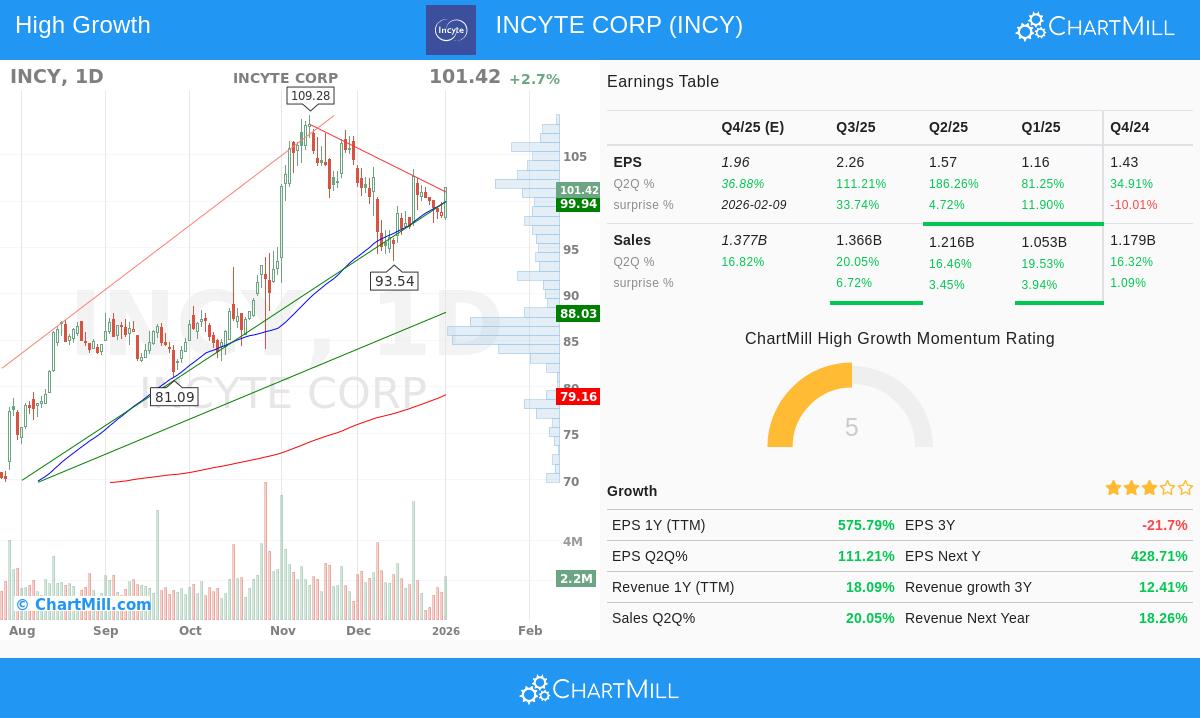
- Moving Average Order: The 50-day SMA ($99.97) is above both the 150-day SMA ($85.25) and the 200-day SMA ($79.16), while the 150-day SMA is also above the 200-day. This step-by-step order verifies a sound, long-term uptrend is active.
- Nearness to Highs: The stock trades about 45% above its 52-week low of $53.56, showing major recovery and strength. Also, its present level is within 7% of its 52-week high of $109.28, fitting the template's liking for stocks guiding the market and nearing new highs.
- Relative Strength: With a ChartMill Relative Strength (CRS) score of 90.17, Incyte does better than over 90% of the market. High relative strength is a key part of the Minervini method, as it finds market leaders that often keep leading.
This technical view indicates INCY is in a clear Stage 2 advance, the main phase where the strategy aims to invest.
Examining the Growth Momentum Driver
A good chart is only part of the story. The "high growth momentum" part looks for the fundamental cause that usually pushes such strong price trends. Incyte's recent financial results show several signs of quickening momentum that growth investors value.
- Earnings Quickening: The company's quarterly earnings growth (EPS Q2Q) has shown a clear pattern of quickening, changing from 34.9% three quarters ago to 81.3%, then 186.3%, and most lately 111.2%. This step-by-step gain is a standard signal of positive operational change.
- Sales Growth Steadiness: Revenue growth has been solid and stable, with the last four quarters showing year-over-year gains of 16.3%, 19.5%, 16.5%, and 20.0%. This steadiness, paired with a trailing twelve-month revenue growth of 18.1%, points to a lasting expansion path.
- Analyst Belief: Forward estimates are moving up, a main momentum sign. Analyst changes for next year's EPS have grown by 10.6% over the last three months, hinting at increasing belief in the company's profit view.
- Profitability Growth: Maybe most importantly, the company's quarterly profit margin has grown notably, from 17.1% three quarters ago to 31.1% in the most recent report. This increasing profitability can be a big force for earnings growth and investor interest.
These fundamental points, quickening earnings, steady sales growth, rising analyst estimates, and growing margins, form the type of growth story that can support a major uptrend, giving the "catalyst" part stressed in growth momentum methods.
Technical Condition and Setup Summary
ChartMill's own analysis gives a combined view of the stock's technical condition. INCY gets a high Technical Rating of 9 out of 10, showing its good long-term uptrend and better market-relative performance. The long-term trend is rated as positive, while the short-term trend is neutral, pointing to a recent pause within the larger advance.
This pause is seen in a solid Setup Quality Rating of 8. The analysis notes prices have been pulling in lately, making a possible base shape. A support area is found between $97.36 and $100.98, which could act as a reasonable zone for a protective stop-loss order. The report also points out a recent "Pocket Pivot" signal, a volume-based sign often linked to institutional buying during a halt in the trend.
For a detailed look at the support/resistance levels and the automated trade setup idea, you can check the full technical analysis report for INCY.
Locating Like Chances
Incyte Corp shows a case where a strict technical trend filter meets notable fundamental growth momentum. For investors curious in searching for other stocks that fit this double standard of the Minervini Trend Template and high-growth fundamentals, the preset screen can be a helpful beginning point. You can view the present results of this "High Growth Momentum + Trend Template" screen here.
Disclaimer: This article is for informational and educational purposes only. It is not intended as investment advice, a recommendation, or an offer to buy or sell any security. The analysis is based on data provided and certain methodologies, but past performance is not indicative of future results. Always conduct your own due diligence, consider your financial situation and risk tolerance, and consult with a qualified financial advisor before making any investment decisions. Please read our full disclaimer here.