
Illumina Inc (NASDAQ:ILMN) presents an interesting case study for value investors looking for companies trading below their inherent value. The selection process used here centers on finding securities with good valuation numbers while keeping acceptable scores in other basic categories. This method fits with classic value investing ideas, where investors look for good companies temporarily available at lower prices because of market feeling instead of worsening business conditions.
Valuation Metrics
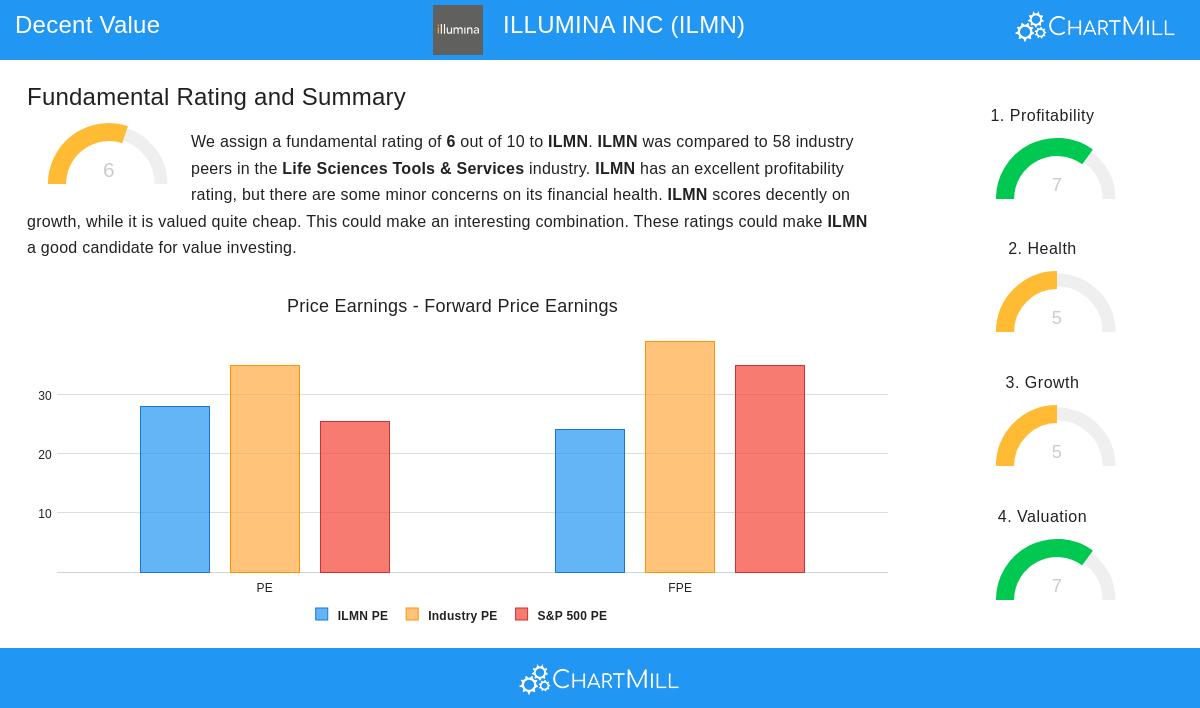
The company's valuation picture is notable as especially strong, with Illumina scoring 7 out of 10 in this group. Several numbers point to possible low pricing compared to both industry counterparts and wider market measures:
• Enterprise Value to EBITDA ratio shows Illumina is less expensive than 86.21% of industry rivals • Price to Free Cash Flow ratio is better than 87.93% of sector counterparts • Forward P/E ratio of 24.12 looks good compared to industry average of 39.10 • PEG ratio indicates payment for growth is still acceptable
These valuation features are important for value investors since they offer the safety buffer Benjamin Graham stressed, buying at costs low enough below inherent value to permit calculation mistakes or short-term business difficulties.
Financial Health Assessment
Illumina's financial health score of 5 shows a mixed image with both positive points and items to watch. The company displays good solvency numbers that value investors usually focus on:
• Altman-Z score of 4.12 shows very low bankruptcy danger • Debt to Free Cash Flow ratio of 1.99 indicates good debt repayment ability • Debt to Equity ratio of 0.42 points to reasonable borrowing
Still, liquidity numbers show some issues, with current and quick ratios lower than many industry counterparts. For value investors, sufficient financial health makes sure the company can survive economic drops while maintaining operations, a main factor when keeping positions during possible market swings.
Profitability Analysis
With a profitability score of 7, Illumina shows strong operational effectiveness that value investors want in low-priced companies:
• Return on Equity of 29.53% is better than 96.55% of industry rivals • Return on Invested Capital of 16.40% is higher than 91.38% of sector counterparts • Operating margin of 20.41% is in the top group of the industry • Gross margin of 66.74% shows price setting ability and cost management
These profitability numbers are key because they signal the company has competitive benefits and effective operations, features that frequently lead to price multiple corrections over periods.
Growth Trajectory
Illumina's growth score of 5 reflects a varied but getting better image. While past sales growth has been moderate, future-pointing signs show potential:
• EPS growth of 152.02% in the last year shows strong recent results • Expected future EPS growth of 24.99% each year points to gaining speed • Steady sales growth forecasts match industry standards
For value investors, fair growth hopes joined with good valuation create the chance for multiple improvement, where both earnings growth and valuation multiple rises add to investor gains.
Investment Considerations
The mix of good valuation, strong profitability, acceptable financial health, and bettering growth outlook makes Illumina worth looking at for value-focused portfolios. As a top company in genetic sequencing technology, the company works in a rising market while presently trading at lower multiples relative to its past norms and industry standing.
Value investors may find special interest in the separation between Illumina's strong profitability numbers and its present valuation. The company's good returns on capital suggest it has lasting competitive benefits, while the valuation multiple does not completely account for this quality.
View the complete fundamental analysis report for Illumina to review all base numbers and comparative industry information.
Discover more value investment chances using our preset screening methods that find companies with similar basic features.
Disclaimer: This analysis is for information purposes only and does not form investment guidance, suggestion, or backing of any security. Investors should do their own investigation and talk with financial consultants before making investment choices. Past results do not ensure future outcomes.