
For investors looking to find potential breakout chances in the stock market, a methodical method joining technical condition and entry timing can be very useful. One such technique involves looking for stocks that show both good basic technical momentum and a present price formation indicating a pause, which might come before a notable price shift. This plan centers on two proprietary scores: the ChartMill Technical Rating, which judges the general technical condition and trend force of a stock, and the ChartMill Setup Quality Rating, which measures how well the present price activity is making a base or pause formation that could present a good risk-reward entry point. Stocks that rate well on both measures are seen as leading choices for technical breakout formations, as they show basically good trends that are taking a break, possibly preparing for their next move up.
Technical Strength and Trend Analysis
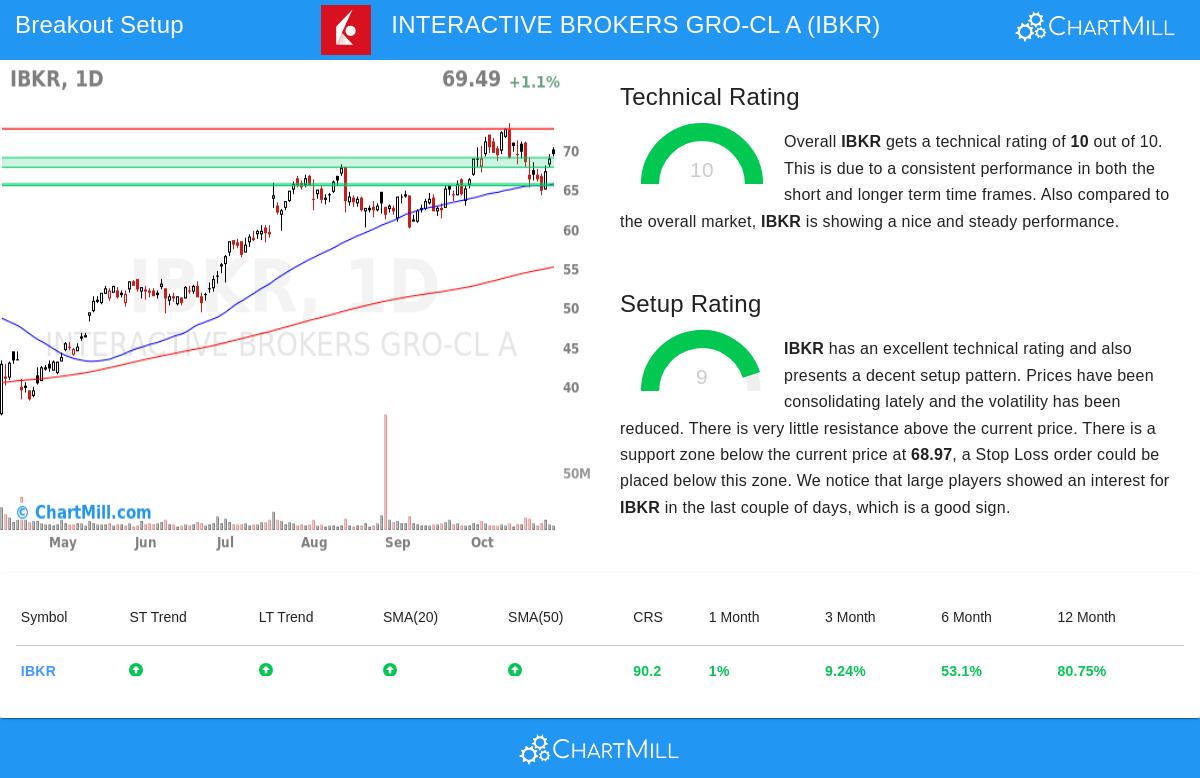
Interactive Brokers Group-CL A (NASDAQ:IBKR) presents a strong technical picture, getting a perfect Technical Rating of 10. This highest-level score is the outcome of a many-sided study of the stock's price action across various time periods. The rating verifies that the stock is not only in a solid uptrend but is also showing better performance compared to the wider market and its industry group. A high Technical Rating is important for the breakout plan because it makes sure an investor is moving with the existing market momentum, raising the chance that a breakout will continue instead of being a false alert.
Key factors adding to IBKR's excellent technical rating include:
- A positive long-term and short-term trend, showing steady buying pressure.
- A 12-month gain of 80.75%, doing better than 90% of all stocks in the market.
- Leadership within its industry, doing better than 95% of the 235 other stocks in the Capital Markets sector.
- A place close to its 52-week high, indicating strong investor belief.
- Trading above all main moving averages (20, 50, 100, and 200-day), with each average in a rising arrangement, confirming the force and width of the uptrend.
The detailed technical report gives more information on these strong points, providing a full view of the stock's technical base.
Setup Quality and Consolidation Pattern
Besides its forceful trend, IBKR shows a high-grade setup, shown by a Setup Rating of 9. This score is important for the breakout method as it deals with the essential question of when to start a trade. A high Setup Rating shows that the stock is in a period of pause, where price movement has lessened and the stock is trading in a somewhat tight band. This makes a specific area of support under the present price and often very little direct resistance above, creating the situation for a possible large move if the stock moves up from this band.
The present setup for IBKR is described by:
- Lessened movement during a recent pause period, allowing for a clearer explanation of support and resistance levels.
- Several set support areas, with the closest important one found between $67.73 and $68.97, giving a sensible level for a protective stop-loss order.
- A noted attention from big players in recent days, as measured by the Effective Volume indicator, which can be a sign before a major price move.
- A clear resistance level at $72.62, which, if passed, could start the expected breakout.
Trade Setup and Market Context
The joining of a perfect Technical Rating and a near-perfect Setup Rating makes a specific, rules-based trading idea. The automated study suggests an entry point just above the found resistance at $72.63, using a buy-stop order to confirm the breakout has happened. The suggested exit, or stop-loss, is set just under the main support area at $67.72. This describes the trade's risk at about 4.91 points or 6.76%. For a portfolio with a 1% total risk tolerance on a single trade, this means an allocation of about 14.79% of money to this position. It is important to see that this particular setup is made automatically and is one reading of the chart; investors might decide to change the entry and exit points based on their own risk management plans and study of the support areas.
This technical setup for IBKR appears within a good wider market situation. The S&P 500 is also showing positive long-term and short-term trends, giving a supportive setting for individual stock breakouts. When good market support joins with a stock showing outstanding individual technicals and a clear pause formation, the situation for a successful trade are improved.
For investors wanting to find other stocks that presently match this high-likelihood breakout model, a new list of chances is made every day. You can find the most present technical breakout formations by visiting the Technical Breakout Setups screen.
Disclaimer: This article is for informational purposes only and does not constitute investment advice of any kind. The analysis and any trade suggestions are based on technical indicators and automated scoring systems and should not be interpreted as a recommendation to buy or sell any security. All investing and trading involves risk, including the possible loss of principal. Always conduct your own research and consider your financial situation and risk tolerance before making any investment decisions.