
For technical investors, finding stocks that are in a solid uptrend and ready for their next move higher is a central task. One organized way to do this is the "Technical Breakout" method, which uses two main measures: a stock's basic technical condition and the state of its present price pause. By concentrating on stocks with good marks in both parts, traders try to find chances where a solid trend is briefly stopping, giving a possible place to enter before a new breakout. This process removes weak stocks and tired rallies, looking for arrangements where risk can be plainly set.
A recent search using this process has pointed to Interactive Brokers Group Inc, Class A (NASDAQ:IBKR) as a candidate showing these traits. The online brokerage firm, which offers trading systems and execution services worldwide, seems to be making a noteworthy technical shape.
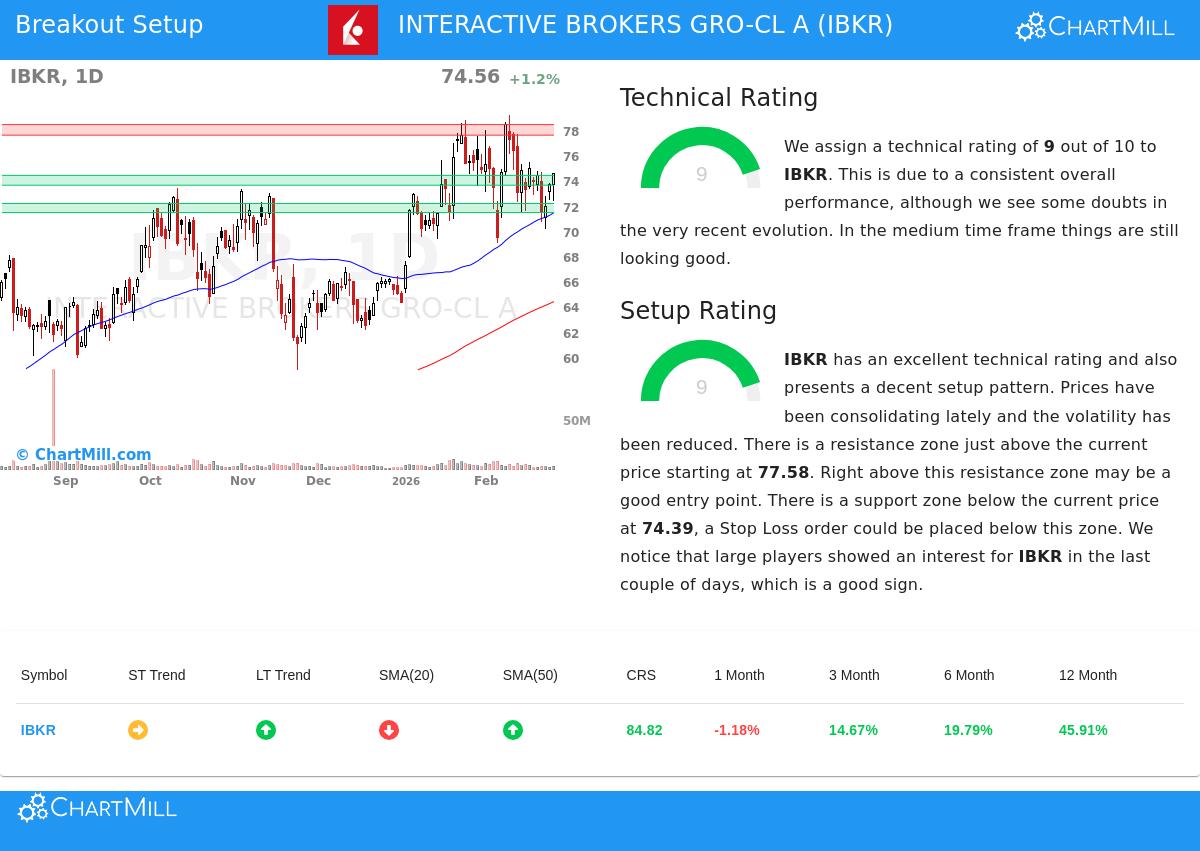
Looking at the Technical Base
The first part of the breakout method is a stock's general technical force, which makes sure we are moving with the existing momentum. Interactive Brokers gets a top ChartMill Technical Rating of 9 out of 10, showing a solid and good long-term trend. This mark is not given easily; it comes from a detailed study of the stock's actions.
- Good Relative Performance: IBKR has been a market frontrunner over the last year, doing better than about 84% of all stocks. Even better, inside its own Capital Markets field, it does better than 89% of its 238 competitors.
- Positive Trend Position: The long-term trend is clearly positive, backed by the stock trading well over its important moving averages (50-day, 100-day, and 200-day). While the short-term trend is now neutral, this is frequently viewed as a time of rest inside a larger upward move.
- Sturdy Price Movement: The stock is trading in the high part of its 52-week range, which went from a low of $32.82 to a recent high of $79.18. Its skill to keep these high levels after a large rise points to basic force.
A high technical rating is key because it answers the "which stock" question. It sorts for market frontrunners that are already in set uptrends, raising the chance that a breakout will lead to a follow-through instead of a wrong sign. You can see the full technical details in the Interactive Brokers Technical Analysis Report.
Judging the Setup State
A solid trend by itself is not a buy sign; entering after a sharp rise often results in buying at a top. This is where the second measure, the Setup Quality Rating, becomes important. It answers the "when to buy" question by finding pause patterns that give sensible entry and exit points. IBKR also gets a 9 out of 10 here, showing a high-grade setup is present.
The study indicates a standard pause stage. After its solid rise, the stock has been trading in a set range between about $69 and $79 over the last month, with recent action tightening near the middle of this area. This lessening in movement and side-to-side action is a sign of a base-forming pattern, where the stock collects energy for its next move.
- Plain Risk and Reward Limits: The setup finds a close resistance area between $77.58 and $78.42. A clear move over this area could signal the start of a new breakout.
- Set Support for Stops: Below the present price, a major support area exists from $73.61 to $74.39, made by a meeting of moving averages and trendlines. This gives a clear area below which a stop-loss order could be set to handle risk.
- Large Player Interest: The report states that big participants have shown buying interest in IBKR lately, a good confirming sign that often comes before notable moves.
A Possible Trading Plan
From this study, a standard breakout setup appears. The proposed entry point is just over the resistance area at $78.43, which would confirm a breakout from the pause. The suggested exit (stop-loss) is set at $73.60, just below the main support area. This plan sets the trade's risk at about 6.2% of the entry price, allowing for exact position sizing.
It is very important to recall that this is an example made from the technical factors. The breakout must be confirmed by price action, and any trade should be fit to a person's risk comfort and method. Always think about outside factors like coming earnings reports or wider market states.
Want to find more technical breakout chances like this one? Our daily scanning process keeps looking at the market for high-likelihood setups. You can see the present list of candidates by going to the Technical Breakout Setups screen.
Disclaimer: This article is for information and example only. The study and described trade setup are from technical indicators and automatic scoring systems. This is not investment advice, a suggestion to buy or sell any security, or a promise of future results. Investing has risk, including the possible loss of principal. Always do your own research, think about your money situation and risk comfort, and talk with a qualified money advisor before making any investment choices.